
Addressing the 3 Pitfalls of Weight Loss Drug Coverage
If you are like most benefits leaders, you are wrestling with the question of whether to cover the new generation of GLP-1 drugs for weight loss, or just for diabetes.
Covering, not covering, and covering with precertification each have major drawbacks. This posting explores those drawbacks…and offers a fourth option, where you can steer only the better candidates to those drugs, to strike the right balance between cost and coverage.
And you can join our joint webinar with US Preventive Medicine (Sept. 7th at noon EDT) by registering here.
Those of you who’ve been reading this blog for years recall the old days of the outcomes-based wellness fad – led by Bravo, Wellsteps and of course Interactive Health – where the “idea” was that if you paid people enough, they would lose weight.
The predictable thing happened: employees gained weight in order to get paid to lose it again. There was even a cottage industry of coaching employees on how to gain weight, with this satirical blog post being (presumably) accidentally clicked on more than 100,000 times by employees googling on “how to cheat in a corporate wellness program.” The “recommendations” in that blog post could harm employees.

Further, it is much easier to cheat because you aren’t being paid to reach a goal weight, as in wellness. . If your BMI is 28, you need only gain ten pounds and, well, the indication for Wegovy is a BMI of 30…and you would qualify.
Share this:

Are Accolade customers violating the Consolidated Appropriations Act?
Addendum June 2024: Looks like Aon did it again, this time for Lyra. Aon is clearly the go-to actuarial consulting firm for any vendor that needs savings to be “shown,” rather than earned.
Executive Summary
The Consolidated Appropriations Act includes civil penalties for private-sector employer fiduciaries who misspend their employee health funds. That would include spending significant sums on vendors whose own data, in plain view, demonstrates they lose money.
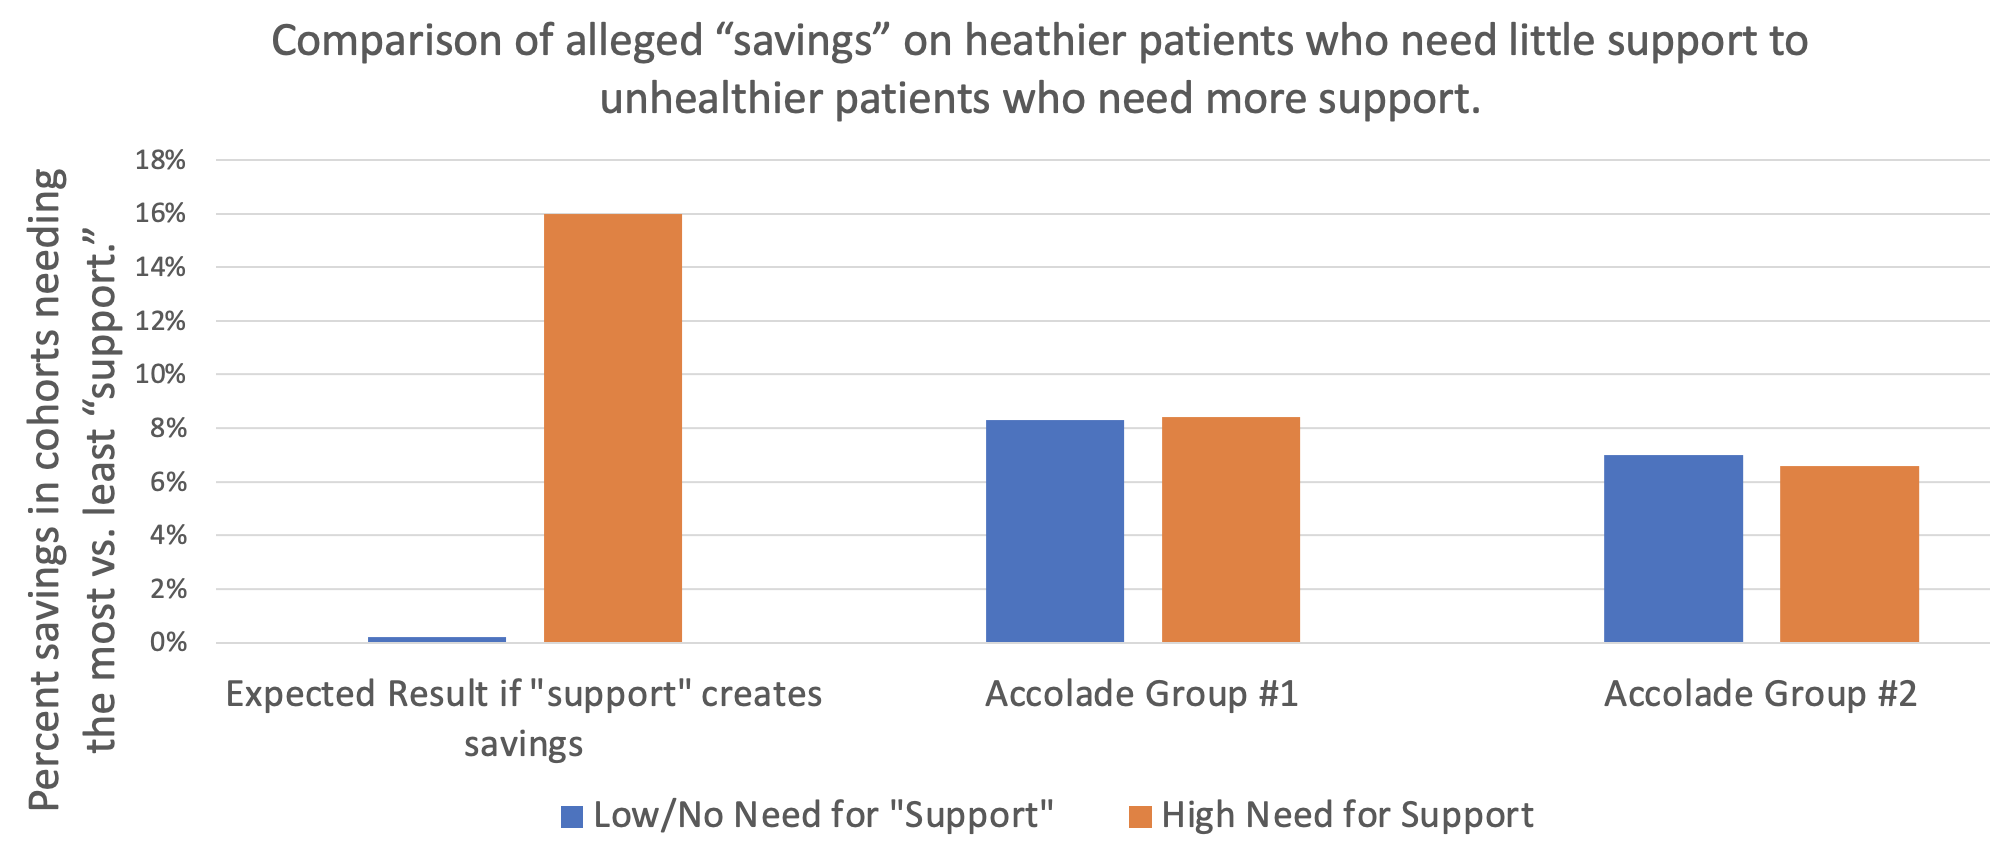
As the graph above shows, Accolade claims to save 8.3% before fees on one study group of their clients and 7% on a second study group of their clients, according to a “validated and rigorous” study available right here.

How do they do this? According to their grammatically challenged website:

If that’s the case, one would expect people who need support to trend much more favorably using the Accolade support resources than people who don’t.
However, the reverse turns out to be true: in neither Accolade group “studied” by Aon did what we will term the “support-sensitive” cohorts (high-acuity) outperform the no/low-acuity cohort – people who would mostly have no reason to seek support. One would expect the opposite. Compare the expectation on the left to the reality in the two sets of bars on the right, showing no net savings (even a negative variance) for the support-sensitive cohorts vs. the cohorts not needing support, in both groups studied:
Accolade is fully aware that this is the true outcome, having declined my offer of a million dollars to show that my analysis is wrong. This puts all their client fiduciaries using this particular service (they also offer benefits guidance to employees and a few other things, where savings are not claimed) in the awkward position of being personally liable for funds misspent on Accolade.
So how did Accolade generate “validated healthcare cost savings” for people who don’t need their services and likely never contacted them?
It turns out that their consultants, Aon, made rookie mistakes in concocting these savings. Once those mistakes are corrected, the opposite result appears, as represented by the 2 sets of bars on the right above.
They violated rules of fifth-grade arithmetic and basic biostatistics.
Arithmetic: Aon misunderstood how to average 5 unequal numbers
Cohort #1: They save money by “supporting” people who have pretty much no need for support
When averaging the 5 categories of morbidities, Aon “forgot” that since most people have nothing or very little wrong with them and only a few people are really sick, the number of people in each of those categories should be weighted differently when calculating an average. Aon averaged the very unequal cohorts the same, instead of weight-averaging them.
Let’s use an extreme example to illustrate this mistake: Suppose 19 of 20 kids in a class score 100% on a quiz, while 1 scores 0%. The average score is obviously 95%. Applying the “methodology” that Aon used for this report, where the single kid scoring 0% counts as much as the 19 scoring 100%, Aon would say the average score in that hypothetical is 50%, not 95%. Aon would then conclude the average student flunked, when in reality 95% of these students got A’s.
The entire answer reverses due to Aon’s rookie mistake.
What Aon did for Accolade was quite similar: they equal-weighted the phantom “savings” from the 18,062 people with virtually nothing wrong with them (and hence would have no reason to call Accolade for “support,” and wouldn’t generate savings anyway because they weren’t spending much) with the 3831 support-sensitive people who had 2 or more comorbidities:

Let’s graph this up and watch what happens. First, a simple graph of those numbers. For some reason if you have 3 comorbidities, their magic doesn’t work, but I’ll leave that for health services researchers to dissect:

Collapsing those three bars on the right into one weight-average yellow bar for the support-sensitive members with multiple comorbidities yields:

Next, let’s collapse the two blue bars into one weight-average blue bar for people who (possibly with a few exceptions) would have no need for Accolade support:

Here is the difference:
- Aon-miscalculated incorrect savings: 8.3%
- Actual correctly calculated variance in trend between the 3831 multiply comorbid support-sensitive people with 2 or more things wrong with them and the 24,849 healthier employees with nothing or almost nothing wrong with them: 0.1%
Aon therefore overstated savings-before-fees by 830%. The overstatement of savings-after-fees is not calculable since putting fees into the equation causes significant losses…and hence likely CAA liability for their customers.
Cohort #2: They save money by “supporting” people who have absolutely no need for support
In the second study group, the weight-average of all 4 morbid cohorts shows that they actually lost money for their customers even before fees, as compared to people with zero health issues for Accolade to “support.” Here is the graph, with the raw analysis provided at the end:
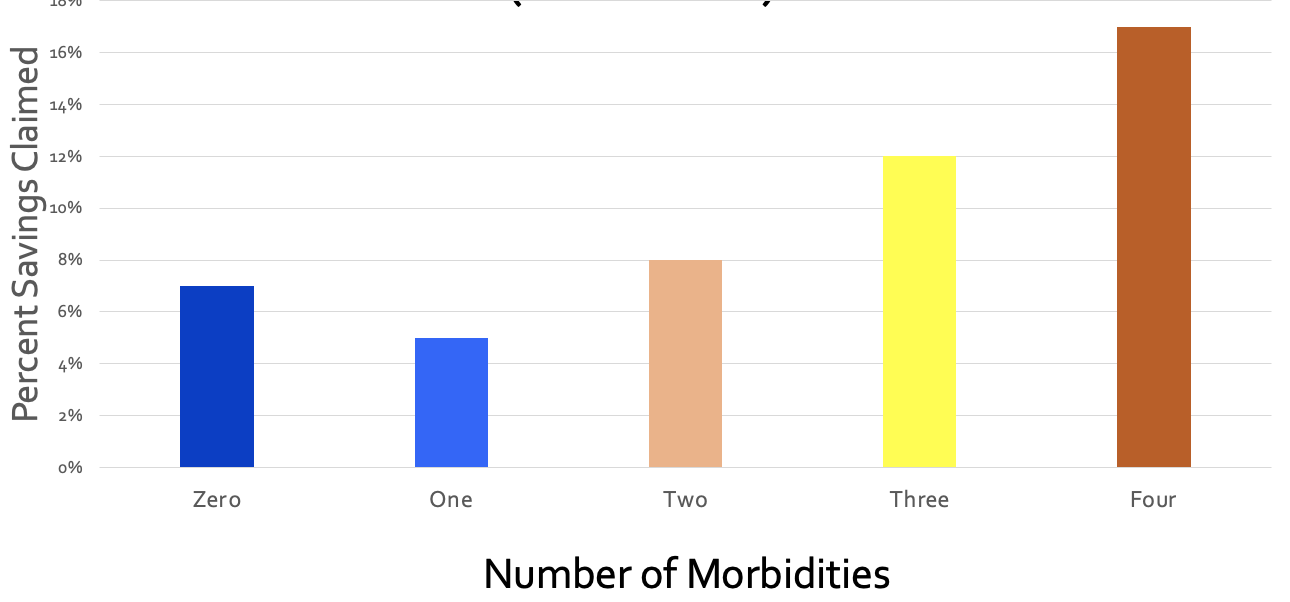
In this study group, as one would expect, the more morbidities a person has, the better job Accolade does at supporting them. And yet somehow they managed to save 7% by allegedly supporting the 64% of the population who mostly didn’t have anything that needed supporting.
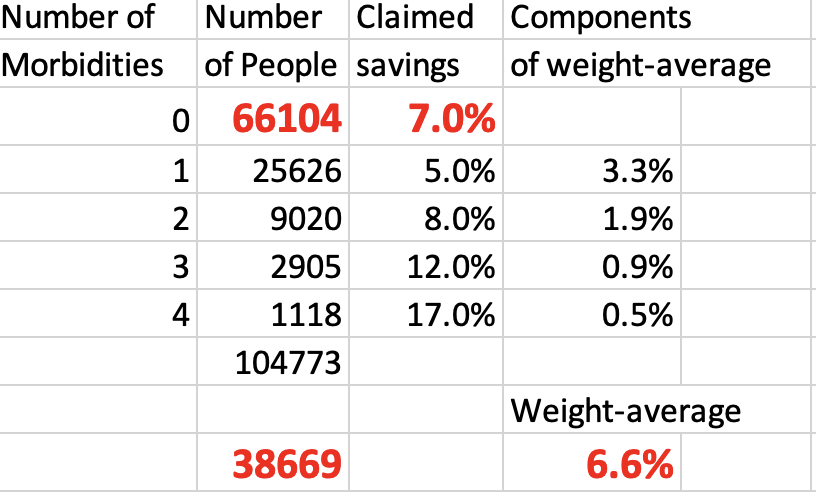
Further, of the people who did have something wrong with them, the vast majority had only one chronic condition. That means when you weight-average all the morbidity cohorts and compare the support-sensitive people to the people who (likely with an exception here or there) don’t need Accolade’s help, you get:

To summarize:
- Aon-calculated phantom “savings” for the 66,104 people with nothing wrong with them, who spend very little money on healthcare and who most likely would never need or contact them for care: 7.0%
- Aon-calculated savings for the people whom Accolade might have talked to: 6.6%
- Actual corrected negative impact of possibly having a reason to contact Accolade: minus-0.4%.
They lost money even before fees are subtracted, according to their own data:
There is only one way to save money vs. trend on people whom you don’t interact with and who have nothing wrong with them, and that’s to inflate the trend. Inflating the trend is a staple of the vendor industry.
Biostatistics: Aon used an obviously invalid control group
Just like weight-averaging is Actuarial Science 101, knowing how to set a trend is Biostatistics 101. You get the same result biostatistically as actuarily. Let’s look at it biostatistically.
The baseline trend should not be one that Aon alleges would have happened anyway based on some cherrypicked random unnamed companies. Rather, it should be the trend of the 0 (or 0 and 1) morbidity categories in the companies that signed up with Accolade. There is virtually nothing that care navigation/support can do for people who mostly (Study Group 1) or totally (Study Group 2) don’t need care navigation/support because they aren’t spending money on high-cost care to begin with.
But everything else is the same if the same companies are used as the controls, making “same companies” the correct control group. You are holding everything constant except the possibility of benefiting from care navigation. Isolating those who would qualify for care navigation allows the reader to see the impact of care navigation when everything else is held constant.
The central tenet of a “control group” – which Aon would know if they’ve read either of my award-winning books or taken a basic course (mine or anyone else’s) in study design – is to be “identical in all respects” except the respect you are evaluating. Using cherrypicked anonymous random companies as a control is exactly the opposite. Here is an easily understood table that explains how to do basic case-control analysis, using the “identical in all respects” standard:

The percent increase in costs in the zero (or 0-1, in Accolade’s first cohort) morbidity group would therefore be the obvious proxy for the likely percent increase in costs of the comorbid categories if they did not have access to Accolade’s support.
Using the same-company control group methodology yields the following:
| Same Company | ||
| Control Group Savings | Support-sensitive Group Savings | |
| First Cohort | 8.3% | 8.4% |
| Second Cohort | 7.0% | 6.6% |
You get the same result when you fix this biostatistical mistake as when you fix the weight-average arithmetic mistake. Even before fees are subtracted:
- Cohort #1: There is no statistically significant cost savings on support-sensitive group;
- Cohort #2: The support-sensitive group trended 40 basis points worse.
Despite my requests, Accolade has not corrected this on their website. If you’d like to ask them, the email to request the correction (or to suggest taking me up on my million-dollar bet) is Steve.barnes@accolade.com or steven.barnes@accolade.com.
If you are an advisor and you have private-sector clients using Accolade, you might want to let them know this looks like a prima facie violation of CAA.
Also, I am not an expert in SEC regulations, but I think they would need to disclose that their front-page go-to “validated” and “rigorous” savings claim analysis is incorrect because the 5 categories of morbidity are averaged instead of weight-averaged.*
*Source: any fifth-grade math teacher.

