
Home » Validation
Category Archives: Validation
Are Accolade customers violating the Consolidated Appropriations Act?
Addendum June 2024: Looks like Aon did it again, this time for Lyra. Aon is clearly the go-to actuarial consulting firm for any vendor that needs savings to be “shown,” rather than earned.
Executive Summary
The Consolidated Appropriations Act includes civil penalties for private-sector employer fiduciaries who misspend their employee health funds. That would include spending significant sums on vendors whose own data, in plain view, demonstrates they lose money.
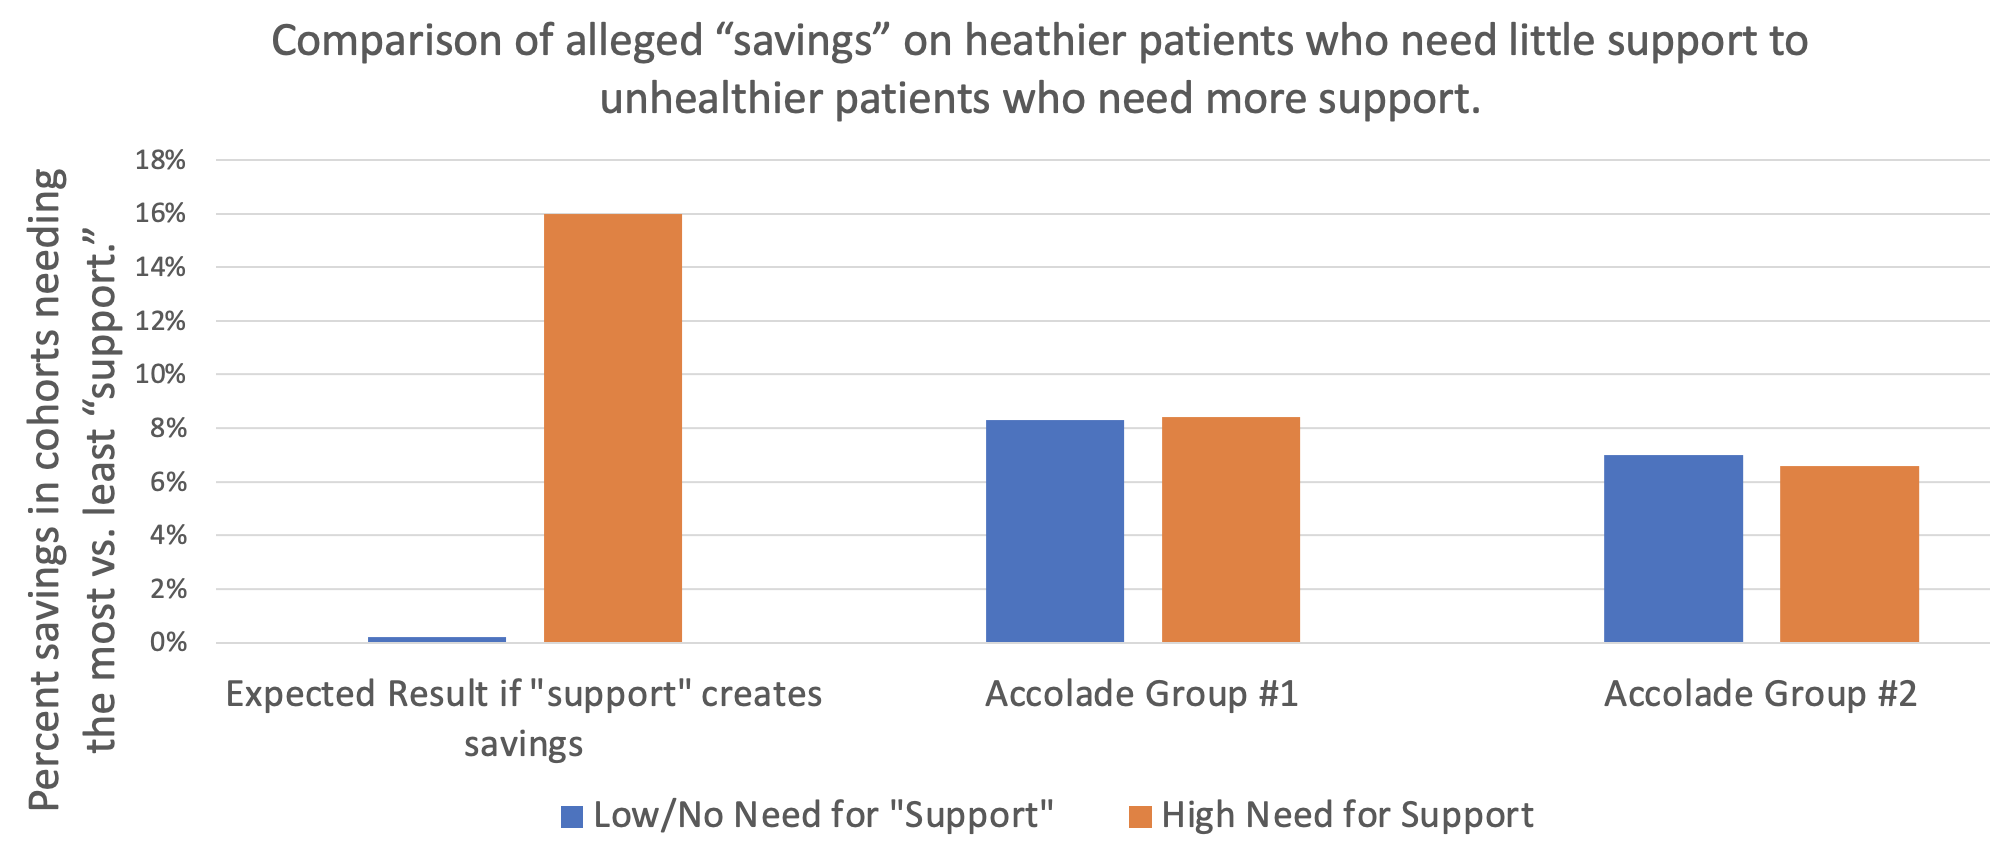
As the graph above shows, Accolade claims to save 8.3% before fees on one study group of their clients and 7% on a second study group of their clients, according to a “validated and rigorous” study available right here.

How do they do this? According to their grammatically challenged website:

If that’s the case, one would expect people who need support to trend much more favorably using the Accolade support resources than people who don’t.
However, the reverse turns out to be true: in neither Accolade group “studied” by Aon did what we will term the “support-sensitive” cohorts (high-acuity) outperform the no/low-acuity cohort – people who would mostly have no reason to seek support. One would expect the opposite. Compare the expectation on the left to the reality in the two sets of bars on the right, showing no net savings (even a negative variance) for the support-sensitive cohorts vs. the cohorts not needing support, in both groups studied:
Accolade is fully aware that this is the true outcome, having declined my offer of a million dollars to show that my analysis is wrong. This puts all their client fiduciaries using this particular service (they also offer benefits guidance to employees and a few other things, where savings are not claimed) in the awkward position of being personally liable for funds misspent on Accolade.
So how did Accolade generate “validated healthcare cost savings” for people who don’t need their services and likely never contacted them?
It turns out that their consultants, Aon, made rookie mistakes in concocting these savings. Once those mistakes are corrected, the opposite result appears, as represented by the 2 sets of bars on the right above.
They violated rules of fifth-grade arithmetic and basic biostatistics.
Arithmetic: Aon misunderstood how to average 5 unequal numbers
Cohort #1: They save money by “supporting” people who have pretty much no need for support
When averaging the 5 categories of morbidities, Aon “forgot” that since most people have nothing or very little wrong with them and only a few people are really sick, the number of people in each of those categories should be weighted differently when calculating an average. Aon averaged the very unequal cohorts the same, instead of weight-averaging them.
Let’s use an extreme example to illustrate this mistake: Suppose 19 of 20 kids in a class score 100% on a quiz, while 1 scores 0%. The average score is obviously 95%. Applying the “methodology” that Aon used for this report, where the single kid scoring 0% counts as much as the 19 scoring 100%, Aon would say the average score in that hypothetical is 50%, not 95%. Aon would then conclude the average student flunked, when in reality 95% of these students got A’s.
The entire answer reverses due to Aon’s rookie mistake.
What Aon did for Accolade was quite similar: they equal-weighted the phantom “savings” from the 18,062 people with virtually nothing wrong with them (and hence would have no reason to call Accolade for “support,” and wouldn’t generate savings anyway because they weren’t spending much) with the 3831 support-sensitive people who had 2 or more comorbidities:

Let’s graph this up and watch what happens. First, a simple graph of those numbers. For some reason if you have 3 comorbidities, their magic doesn’t work, but I’ll leave that for health services researchers to dissect:

Collapsing those three bars on the right into one weight-average yellow bar for the support-sensitive members with multiple comorbidities yields:

Next, let’s collapse the two blue bars into one weight-average blue bar for people who (possibly with a few exceptions) would have no need for Accolade support:

Here is the difference:
- Aon-miscalculated incorrect savings: 8.3%
- Actual correctly calculated variance in trend between the 3831 multiply comorbid support-sensitive people with 2 or more things wrong with them and the 24,849 healthier employees with nothing or almost nothing wrong with them: 0.1%
Aon therefore overstated savings-before-fees by 830%. The overstatement of savings-after-fees is not calculable since putting fees into the equation causes significant losses…and hence likely CAA liability for their customers.
Cohort #2: They save money by “supporting” people who have absolutely no need for support
In the second study group, the weight-average of all 4 morbid cohorts shows that they actually lost money for their customers even before fees, as compared to people with zero health issues for Accolade to “support.” Here is the graph, with the raw analysis provided at the end:
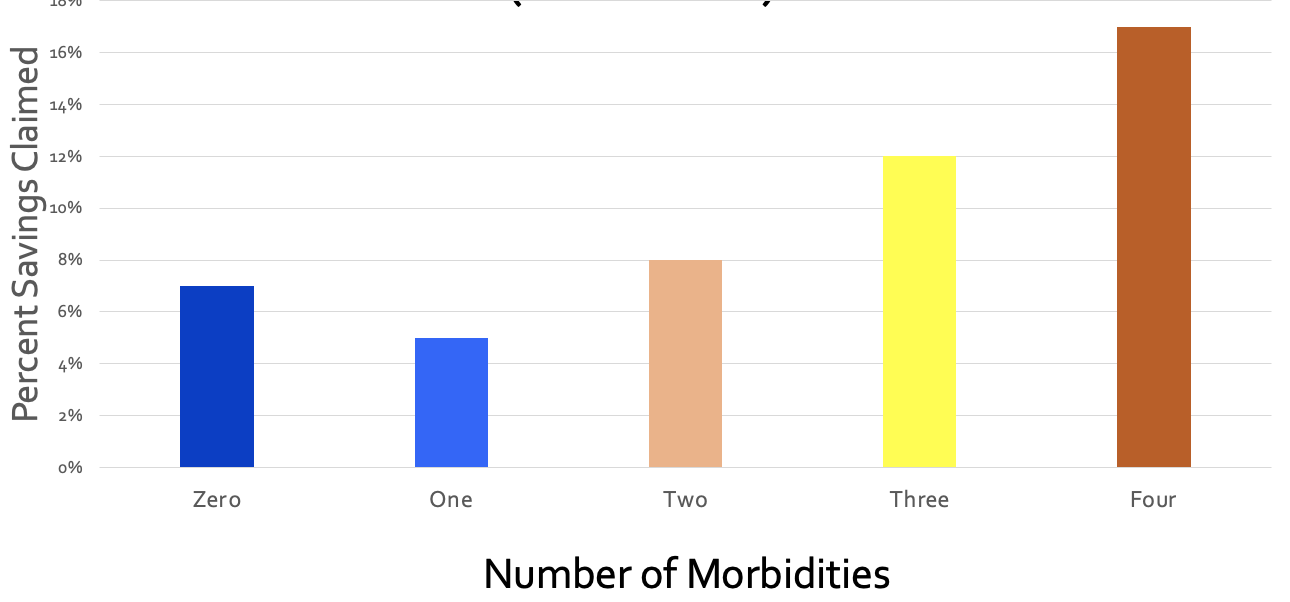
In this study group, as one would expect, the more morbidities a person has, the better job Accolade does at supporting them. And yet somehow they managed to save 7% by allegedly supporting the 64% of the population who mostly didn’t have anything that needed supporting.
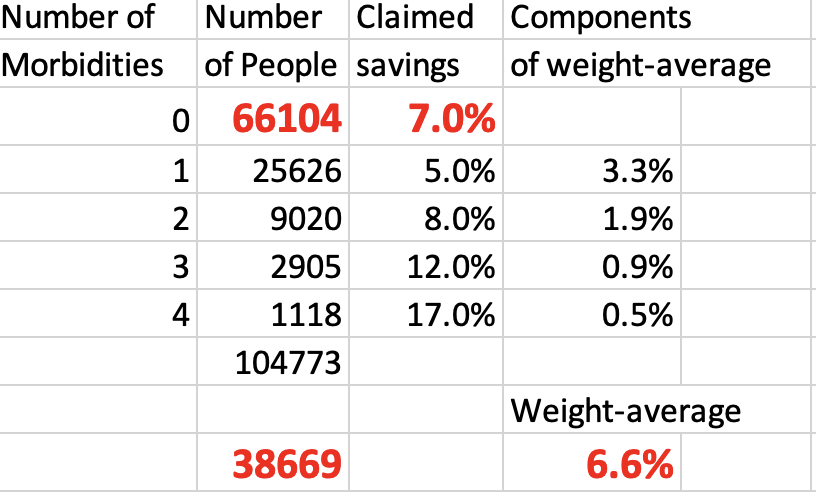
Further, of the people who did have something wrong with them, the vast majority had only one chronic condition. That means when you weight-average all the morbidity cohorts and compare the support-sensitive people to the people who (likely with an exception here or there) don’t need Accolade’s help, you get:

To summarize:
- Aon-calculated phantom “savings” for the 66,104 people with nothing wrong with them, who spend very little money on healthcare and who most likely would never need or contact them for care: 7.0%
- Aon-calculated savings for the people whom Accolade might have talked to: 6.6%
- Actual corrected negative impact of possibly having a reason to contact Accolade: minus-0.4%.
They lost money even before fees are subtracted, according to their own data:
There is only one way to save money vs. trend on people whom you don’t interact with and who have nothing wrong with them, and that’s to inflate the trend. Inflating the trend is a staple of the vendor industry.
Biostatistics: Aon used an obviously invalid control group
Just like weight-averaging is Actuarial Science 101, knowing how to set a trend is Biostatistics 101. You get the same result biostatistically as actuarily. Let’s look at it biostatistically.
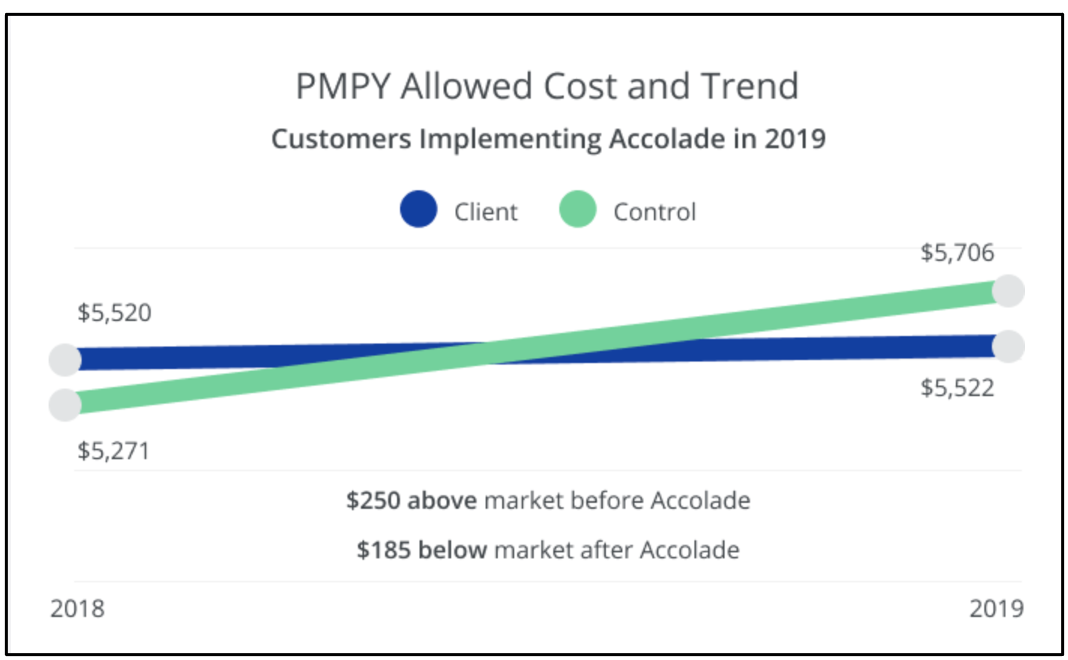
The baseline trend should not be one that Aon alleges would have happened anyway based on some cherrypicked random unnamed companies. Rather, it should be the trend of the 0 (or 0 and 1) morbidity categories in the companies that signed up with Accolade. There is virtually nothing that care navigation/support can do for people who mostly (Study Group 1) or totally (Study Group 2) don’t need care navigation/support because they aren’t spending money on high-cost care to begin with.
But everything else is the same if the same companies are used as the controls, making “same companies” the correct control group. You are holding everything constant except the possibility of benefiting from care navigation. Isolating those who would qualify for care navigation allows the reader to see the impact of care navigation when everything else is held constant.
The central tenet of a “control group” – which Aon would know if they’ve read either of my award-winning books or taken a basic course (mine or anyone else’s) in study design – is to be “identical in all respects” except the respect you are evaluating. Using cherrypicked anonymous random companies as a control is exactly the opposite. Here is an easily understood table that explains how to do basic case-control analysis, using the “identical in all respects” standard:

The percent increase in costs in the zero (or 0-1, in Accolade’s first cohort) morbidity group would therefore be the obvious proxy for the likely percent increase in costs of the comorbid categories if they did not have access to Accolade’s support.
Using the same-company control group methodology yields the following:
| Same Company | ||
| Control Group Savings | Support-sensitive Group Savings | |
| First Cohort | 8.3% | 8.4% |
| Second Cohort | 7.0% | 6.6% |
You get the same result when you fix this biostatistical mistake as when you fix the weight-average arithmetic mistake. Even before fees are subtracted:
- Cohort #1: There is no statistically significant cost savings on support-sensitive group;
- Cohort #2: The support-sensitive group trended 40 basis points worse.
Despite my requests, Accolade has not corrected this on their website. If you’d like to ask them, the email to request the correction (or to suggest taking me up on my million-dollar bet) is Steve.barnes@accolade.com or steven.barnes@accolade.com.
If you are an advisor and you have private-sector clients using Accolade, you might want to let them know this looks like a prima facie violation of CAA.
Also, I am not an expert in SEC regulations, but I think they would need to disclose that their front-page go-to “validated” and “rigorous” savings claim analysis is incorrect because the 5 categories of morbidity are averaged instead of weight-averaged.*
*Source: any fifth-grade math teacher.
Share this:


A vendor’s guide to snookering self-insured employers
Dear Wellness, Diabetes, Clinic, Price Transparency, and Medication Therapy Management Vendors,
While most of you already know the majority of these tricks, there might be a few you haven’t deployed yet. So take good notes.
Sincerely,
Al Lewis
PS If you are an employer, just pass this along to your vendors…and watch your savings skyrocket. Or use “An Employer’s Guide to NOT being snookered” to see your savings become realistic.
Best practices for every vendor
Compare participants to non-participants. Using non-participants as a control for participants allows you to show massive savings without doing anything. This is not an overstatement. Here is a program — which naturally won an award for its brilliance from Ron Goetzel and his friends before I observed that they were a fraud according to their own data– that did just that. They separated participants from non-participants but didn’t bother to implement a program for two years—by which point the participants had already improved by 20% vs. the non-participants — without even having a program to participate in. (Note on this slide that the control and study group were set up in 2004 but the program didn’t start until 2006, when the cost separation had already reached the aforementioned 20%.)

Two other observational trials support this conclusion. Most recently, the National Bureau of Economic Research ran a controlled trial to test exactly this hypothesis. Sure enough, like the three observational trials, they found that virtually the entire outcome in wellness can be explained by that popular study design itself, rather than the intervention.
In any participation-based program, ignore dropouts. Assume that employees who drop out do so randomly, not because they are discouraged by their lack of progress or interest.
Draw a line upwards and then claim credit for the “savings” between the actual upward spending and the “trend” you drew. As Optum’s Seth Serxner stated so succinctly: “We can conclude that the choice of trend has a large impact on estimates of financial savings.”

Start with the ridiculously high utilizers, high-risk people, or people taking lots of drugs. Let the group regress to the mean, and then claim that as savings.
Never admit, like Wellsteps did, that you are familiar with regression to the mean, since most employers are not aware of it. The higher the costs/risks of the original users, the more savings you can claim. Here are two verbatim claims:
- A heavy equipment manufacturer found high use of the ER was a becoming a cost concern, so it send mailings that showed appropriate care settings to the homes of members with two or more visits to the ER in the past year. As a result, ER visits were down 59 percent those who got the mailing.
- A pharmaceutical company saw a spike in ER claims was coming from repeated use by the same people, so two mailers were sent: one to households with one ER visit in the past year; another for those with two or more visits. Following the mailings, there was a 63 percent drop in ER visits.
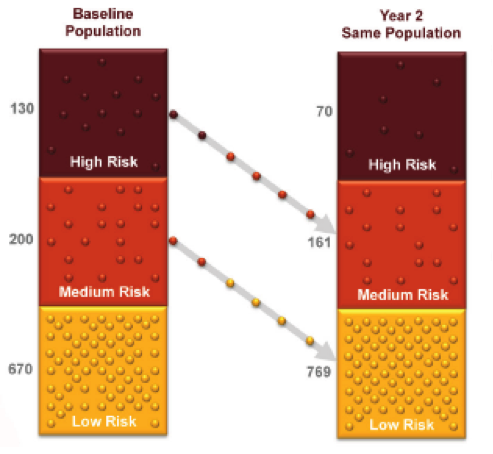
Pretend not to notice that low utilizers can show an increase in utilization — or especially that low-risk people can increase in risk. Focus the mark (I mean, the customer) on the high-risk people who decline in risk. Never draw graphs to scale, or your customer might notice that 2/3 of their employees are low-risk in the first place.
It doesn’t matter what your intervention is. Claim credit for the entire difference in trend. For instance, in this example, Community Care of North Carolina claimed credit for a huge reduction in PMPM costs for babies for their medical home program…but babies weren’t even included in the program. (Neonatal expenses didn’t decline either.)

Or do what Safeway did, launching the wellness craze: change to a high-deductible plan, and transfer a large chunk of costs to employees. Don’t even bother to institute a wellness program, but attribute all the savings (from the transferred deductible spending) to wellness anyway, so that you get invited to the White House. And after that blows up on you, demonstrate that your very stable genius investment in wellness was not a fluke by investing your company’s money in Theranos.
Special Instructions for transparency tool vendors
Assume that every employee who uses your tool is looking to save their bosses some money, rather than (for instance) to find the closest MRI…and that none of them would have used a lower-cost venue absent your tool.
If only 10% of employees use your transparency tool, and only 10% of events are shoppable, nonetheless take credit for the entire difference in trend across the board, and ignore the literature showing online price-comparison tools don’t work.
If people who haven’t met their deductible shop more than people who have, attribute the former’s lower cost to use of the tool, rather than to the fact that by definition people who don’t meet their deductible spend less than people who blow through it.
Special instructions for wellness and diabetes vendors
If you are a wellness or diabetes prevention/management vendor, never ever let employers know that every year since statistics have been kept, fewer than 1 in 1000 employees/dependents end up in the hospital with diabetes. (And another 1 in 1000 with a heart attack.) Always tell them how many employees are at risk and how many “newly discovered conditions” they have, and how they will all end up in the hospital, even though hospitalizations for heart attacks and diabetes in the employer-insured population have been declining for years.

Wellness vendors should always put the trivial percentage reduction in risk (for participants only, of course – and ignoring dropouts) on one page and the massive savings on another page. Most employers won’t bother to do the math to notice, for example, that Interactive Health claimed $50,000 in savings for every employee who reduced one risk factor, while the state of Nebraska won an award for claiming to save $20,000+ for every risk factor reduced, as did Staywell for British Petroleum.
If you didn’t reduce risk factors, present your outcomes in a format no one can make heads or tails of, like this one, from Wellsteps. If Wellsteps was able to snooker an entire committee of self-anointed outcomes experts to win an award for program excellence, surely you can snooker a few customers.

Claiming people lose weight is a big part of your outcome reporting, so make sure to do the following:
- Never count nonparticipants, and ignore dropouts.
- Don’t do any long-term follow-up to see who regained the weight (most participants)
- Give them time to binge before the initial weigh-in
Special instructions for diabetes vendors
In addition to measuring on active participants only, raise the bar for Hb A1c so that only people with high Hb A1c’s can be included. That belt-and-suspenders approach will ensure that you can’t fail to show savings, even if (as is likely the case) you don’t change anyone’s behavior other than the employees who were going to change anyway, which you might as well count.
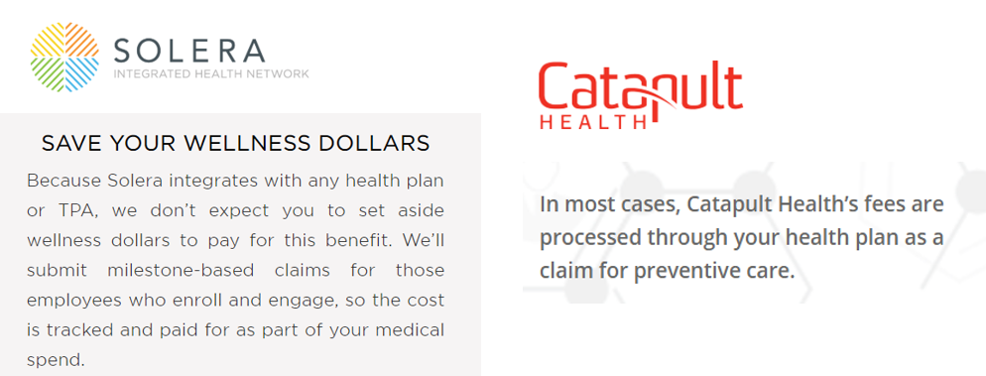
Next — most diabetes vendors and a few wellness vendors have already figured this out — you can charge much more if you can submit claims, rather than just be an admin expense line item. You see, most employers focus much more on the 10% admin expense than they do the 90% medical expense, which they consider to be beyond their control. Your claims expense – which would draw attention to itself as an admin cost — won’t get noticed in the 90% of medical losses, sort of like the dirt from the tunnel sprinkled around the Stalag in The Great Escape.

Special instructions for medication therapy management vendors
Only mention “gaps in care” that you close, not the ones that open up. And, as noted in the chart below, always use percentages. So in this chart (provided by one of the major PBMs), they claimed that twice as many gaps were closed (37%) vs opened (18%), and yet, as is almost always the case with MTM vendors, nothing happened to the total number of gaps, which remained at exactly 820:

Tally all the employees who were on large numbers of meds and now take fewer. But don’t mention all the employers who were on fewer meds and now take more.
What to do if you’re asked why you aren’t validated by the Validation Institute
Here are the most popular answers to that question:
- No one has asked us to. (Quizzify didn’t need to be asked.)
- We hired our own outside actuarial firm to validate us, and they concluded we save a lot of money.
- Sure, we’ll get validated as soon as you sign the contract with us.

