Home » Posts tagged 'Accolade'
Tag Archives: Accolade
Are Accolade customers violating the Consolidated Appropriations Act?
Addendum June 2024: Looks like Aon did it again, this time for Lyra. Aon is clearly the go-to actuarial consulting firm for any vendor that needs savings to be “shown,” rather than earned.
Executive Summary
The Consolidated Appropriations Act includes civil penalties for private-sector employer fiduciaries who misspend their employee health funds. That would include spending significant sums on vendors whose own data, in plain view, demonstrates they lose money.
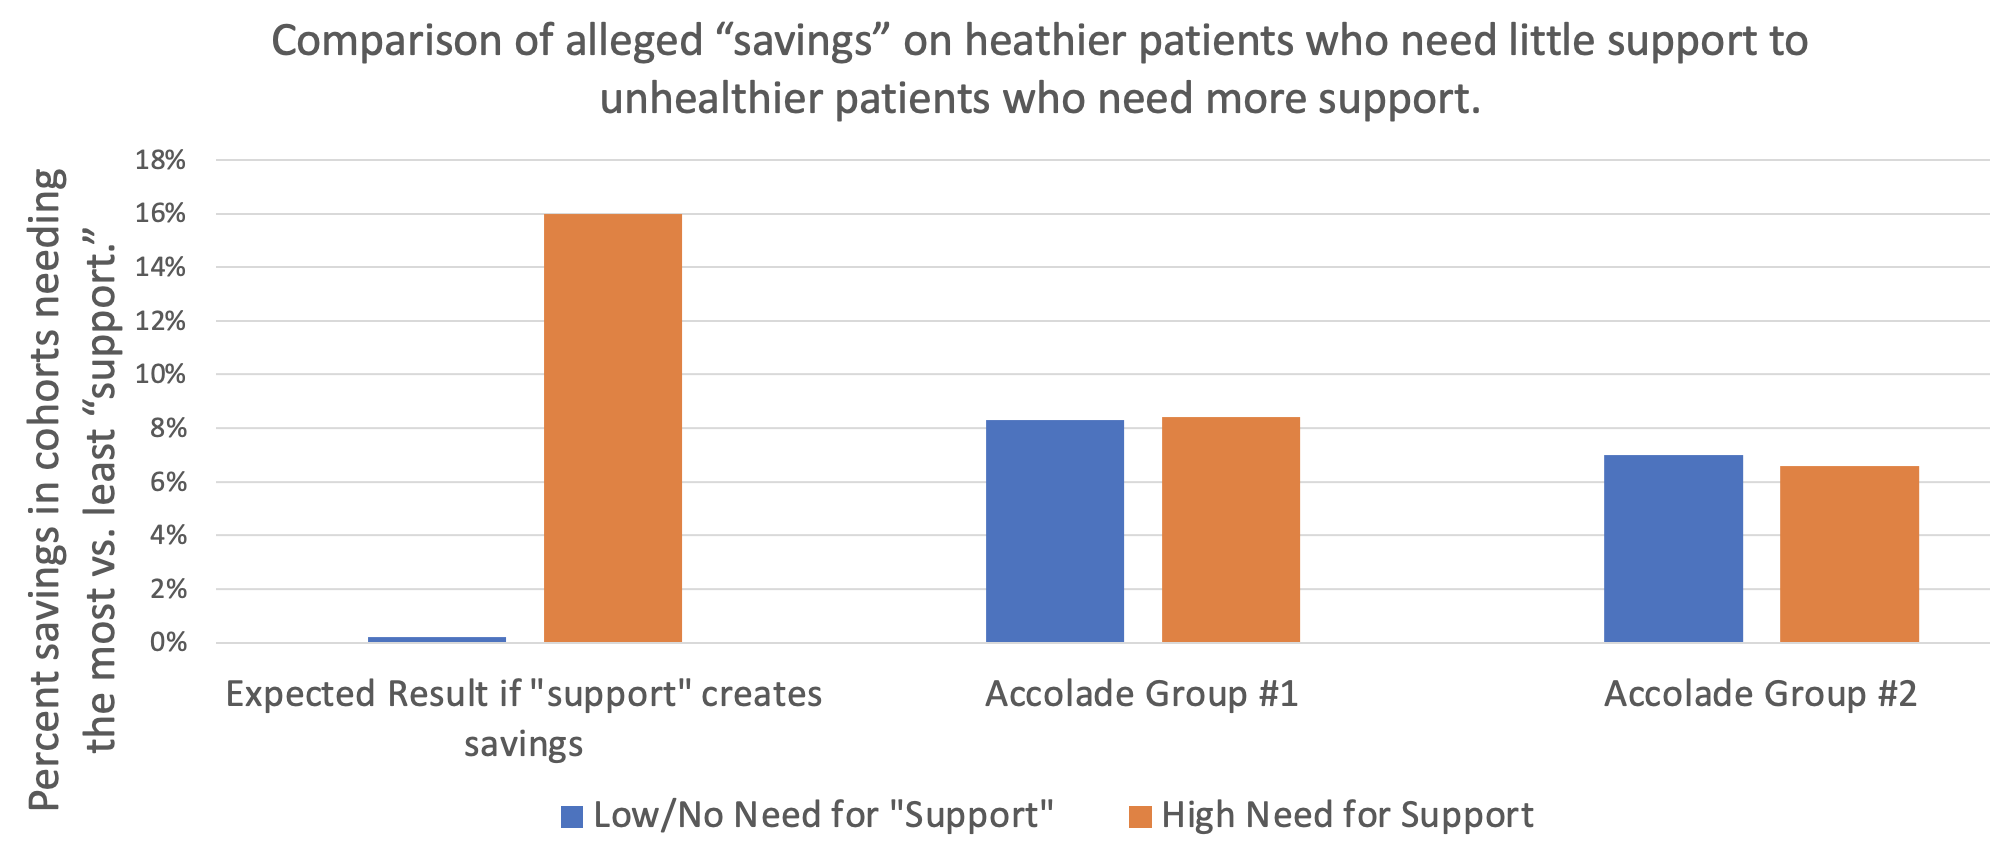
As the graph above shows, Accolade claims to save 8.3% before fees on one study group of their clients and 7% on a second study group of their clients, according to a “validated and rigorous” study available right here.

How do they do this? According to their grammatically challenged website:

If that’s the case, one would expect people who need support to trend much more favorably using the Accolade support resources than people who don’t.
However, the reverse turns out to be true: in neither Accolade group “studied” by Aon did what we will term the “support-sensitive” cohorts (high-acuity) outperform the no/low-acuity cohort – people who would mostly have no reason to seek support. One would expect the opposite. Compare the expectation on the left to the reality in the two sets of bars on the right, showing no net savings (even a negative variance) for the support-sensitive cohorts vs. the cohorts not needing support, in both groups studied:
Accolade is fully aware that this is the true outcome, having declined my offer of a million dollars to show that my analysis is wrong. This puts all their client fiduciaries using this particular service (they also offer benefits guidance to employees and a few other things, where savings are not claimed) in the awkward position of being personally liable for funds misspent on Accolade.
So how did Accolade generate “validated healthcare cost savings” for people who don’t need their services and likely never contacted them?
It turns out that their consultants, Aon, made rookie mistakes in concocting these savings. Once those mistakes are corrected, the opposite result appears, as represented by the 2 sets of bars on the right above.
They violated rules of fifth-grade arithmetic and basic biostatistics.
Arithmetic: Aon misunderstood how to average 5 unequal numbers
Cohort #1: They save money by “supporting” people who have pretty much no need for support
When averaging the 5 categories of morbidities, Aon “forgot” that since most people have nothing or very little wrong with them and only a few people are really sick, the number of people in each of those categories should be weighted differently when calculating an average. Aon averaged the very unequal cohorts the same, instead of weight-averaging them.
Let’s use an extreme example to illustrate this mistake: Suppose 19 of 20 kids in a class score 100% on a quiz, while 1 scores 0%. The average score is obviously 95%. Applying the “methodology” that Aon used for this report, where the single kid scoring 0% counts as much as the 19 scoring 100%, Aon would say the average score in that hypothetical is 50%, not 95%. Aon would then conclude the average student flunked, when in reality 95% of these students got A’s.
The entire answer reverses due to Aon’s rookie mistake.
What Aon did for Accolade was quite similar: they equal-weighted the phantom “savings” from the 18,062 people with virtually nothing wrong with them (and hence would have no reason to call Accolade for “support,” and wouldn’t generate savings anyway because they weren’t spending much) with the 3831 support-sensitive people who had 2 or more comorbidities:

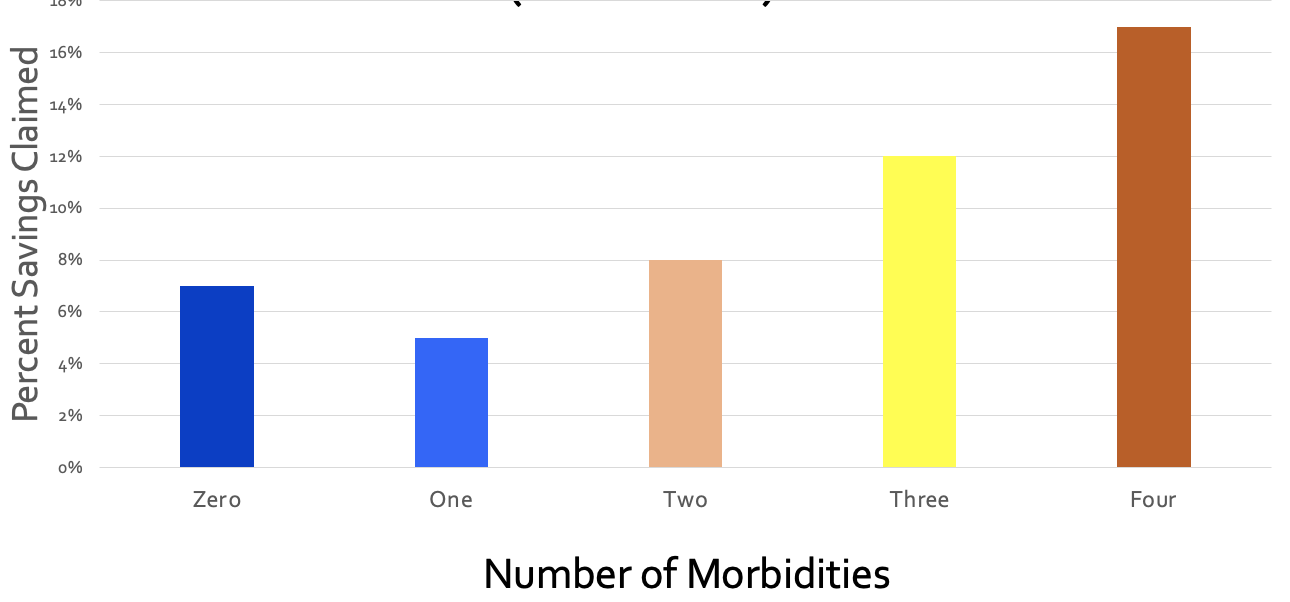
Let’s graph this up and watch what happens. First, a simple graph of those numbers. For some reason if you have 3 comorbidities, their magic doesn’t work, but I’ll leave that for health services researchers to dissect:

Collapsing those three bars on the right into one weight-average yellow bar for the support-sensitive members with multiple comorbidities yields:

Next, let’s collapse the two blue bars into one weight-average blue bar for people who (possibly with a few exceptions) would have no need for Accolade support:

Here is the difference:
- Aon-miscalculated incorrect savings: 8.3%
- Actual correctly calculated variance in trend between the 3831 multiply comorbid support-sensitive people with 2 or more things wrong with them and the 24,849 healthier employees with nothing or almost nothing wrong with them: 0.1%
Aon therefore overstated savings-before-fees by 830%. The overstatement of savings-after-fees is not calculable since putting fees into the equation causes significant losses…and hence likely CAA liability for their customers.
Cohort #2: They save money by “supporting” people who have absolutely no need for support
In the second study group, the weight-average of all 4 morbid cohorts shows that they actually lost money for their customers even before fees, as compared to people with zero health issues for Accolade to “support.” Here is the graph, with the raw analysis provided at the end:
In this study group, as one would expect, the more morbidities a person has, the better job Accolade does at supporting them. And yet somehow they managed to save 7% by allegedly supporting the 64% of the population who mostly didn’t have anything that needed supporting.
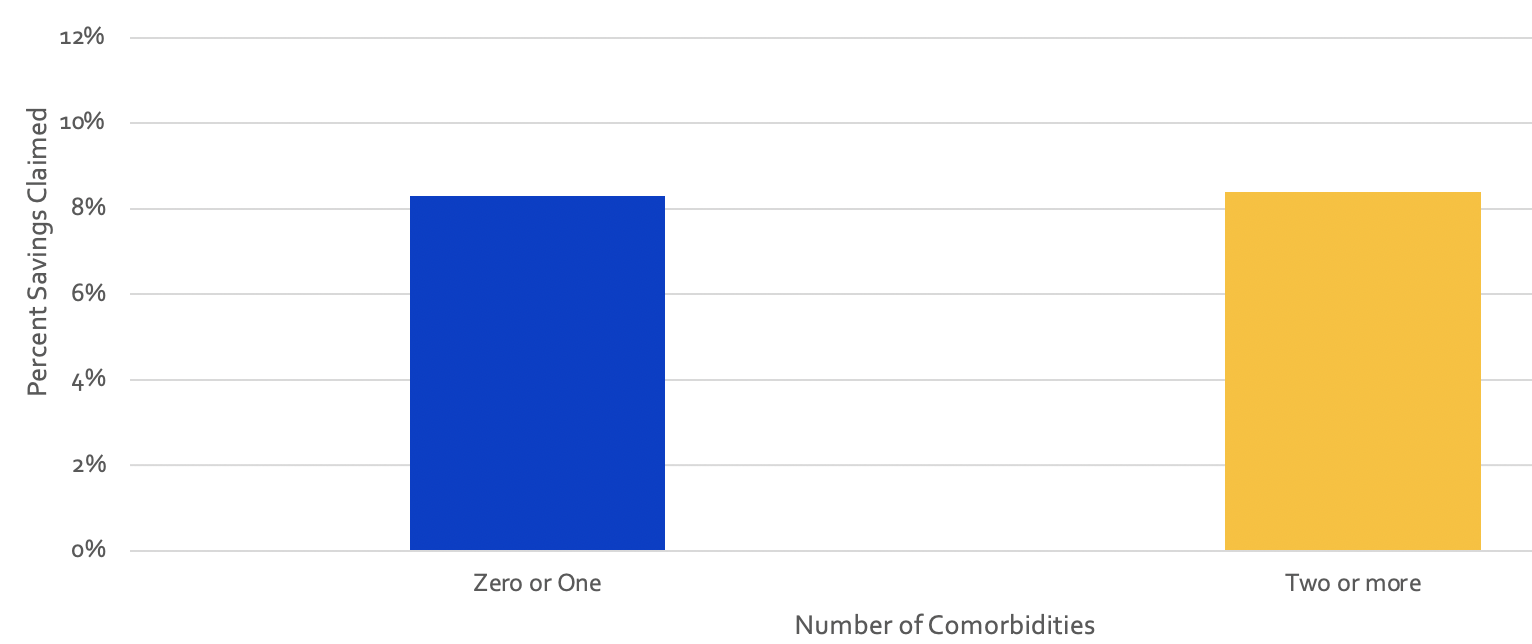
Further, of the people who did have something wrong with them, the vast majority had only one chronic condition. That means when you weight-average all the morbidity cohorts and compare the support-sensitive people to the people who (likely with an exception here or there) don’t need Accolade’s help, you get:

To summarize:
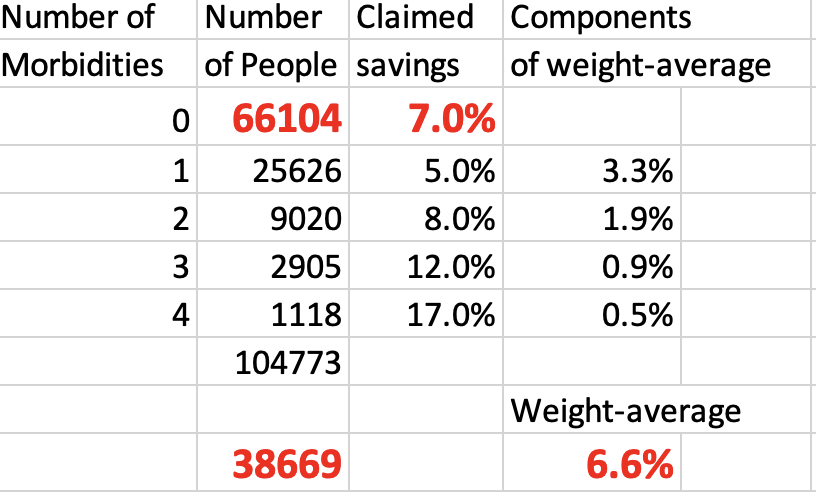
- Aon-calculated phantom “savings” for the 66,104 people with nothing wrong with them, who spend very little money on healthcare and who most likely would never need or contact them for care: 7.0%
- Aon-calculated savings for the people whom Accolade might have talked to: 6.6%
- Actual corrected negative impact of possibly having a reason to contact Accolade: minus-0.4%.
They lost money even before fees are subtracted, according to their own data:
There is only one way to save money vs. trend on people whom you don’t interact with and who have nothing wrong with them, and that’s to inflate the trend. Inflating the trend is a staple of the vendor industry.
Biostatistics: Aon used an obviously invalid control group
Just like weight-averaging is Actuarial Science 101, knowing how to set a trend is Biostatistics 101. You get the same result biostatistically as actuarily. Let’s look at it biostatistically.
The baseline trend should not be one that Aon alleges would have happened anyway based on some cherrypicked random unnamed companies. Rather, it should be the trend of the 0 (or 0 and 1) morbidity categories in the companies that signed up with Accolade. There is virtually nothing that care navigation/support can do for people who mostly (Study Group 1) or totally (Study Group 2) don’t need care navigation/support because they aren’t spending money on high-cost care to begin with.
But everything else is the same if the same companies are used as the controls, making “same companies” the correct control group. You are holding everything constant except the possibility of benefiting from care navigation. Isolating those who would qualify for care navigation allows the reader to see the impact of care navigation when everything else is held constant.
The central tenet of a “control group” – which Aon would know if they’ve read either of my award-winning books or taken a basic course (mine or anyone else’s) in study design – is to be “identical in all respects” except the respect you are evaluating. Using cherrypicked anonymous random companies as a control is exactly the opposite. Here is an easily understood table that explains how to do basic case-control analysis, using the “identical in all respects” standard:

The percent increase in costs in the zero (or 0-1, in Accolade’s first cohort) morbidity group would therefore be the obvious proxy for the likely percent increase in costs of the comorbid categories if they did not have access to Accolade’s support.
Using the same-company control group methodology yields the following:
| Same Company | ||
| Control Group Savings | Support-sensitive Group Savings | |
| First Cohort | 8.3% | 8.4% |
| Second Cohort | 7.0% | 6.6% |
You get the same result when you fix this biostatistical mistake as when you fix the weight-average arithmetic mistake. Even before fees are subtracted:
- Cohort #1: There is no statistically significant cost savings on support-sensitive group;
- Cohort #2: The support-sensitive group trended 40 basis points worse.
Despite my requests, Accolade has not corrected this on their website. If you’d like to ask them, the email to request the correction (or to suggest taking me up on my million-dollar bet) is Steve.barnes@accolade.com or steven.barnes@accolade.com.
If you are an advisor and you have private-sector clients using Accolade, you might want to let them know this looks like a prima facie violation of CAA.
Also, I am not an expert in SEC regulations, but I think they would need to disclose that their front-page go-to “validated” and “rigorous” savings claim analysis is incorrect because the 5 categories of morbidity are averaged instead of weight-averaged.*
*Source: any fifth-grade math teacher.
Share this:


Are Accolade’s savings claims real? You make the call.
Attention, They Said What Nation:
We are available for forensic consulting (taking appellations and kicking posteriors), recoupment of fees, and expert witness work, hourly or on contingency (except for expert witness, where it is not allowed). So if you think a vendor has snookered you, who you gonna call?
We. Never. Lose.
And here is an example of why vendors fold…
Accolade recently announced that they had paid Aon a zillion dollars for their actuaries to decide how much savings they could claim without leaving too many clues that the claimed savings figure is fabricated.

They drew that trendline at 8.3%, and decided the savings was also 8.3% in 2019. Could this be an example of “trend inflation,” where, as Optum’s Seth Serxner says: “The choice of trend has a large impact on financial savings”?
Nah, an actuary would have to be both stupid and dishonest to inflate a trend willy-nilly. it would be too obvious a ruse. You’d show savings in:
- every single disease category
- every single comorbidity/risk category
- every single resource use category
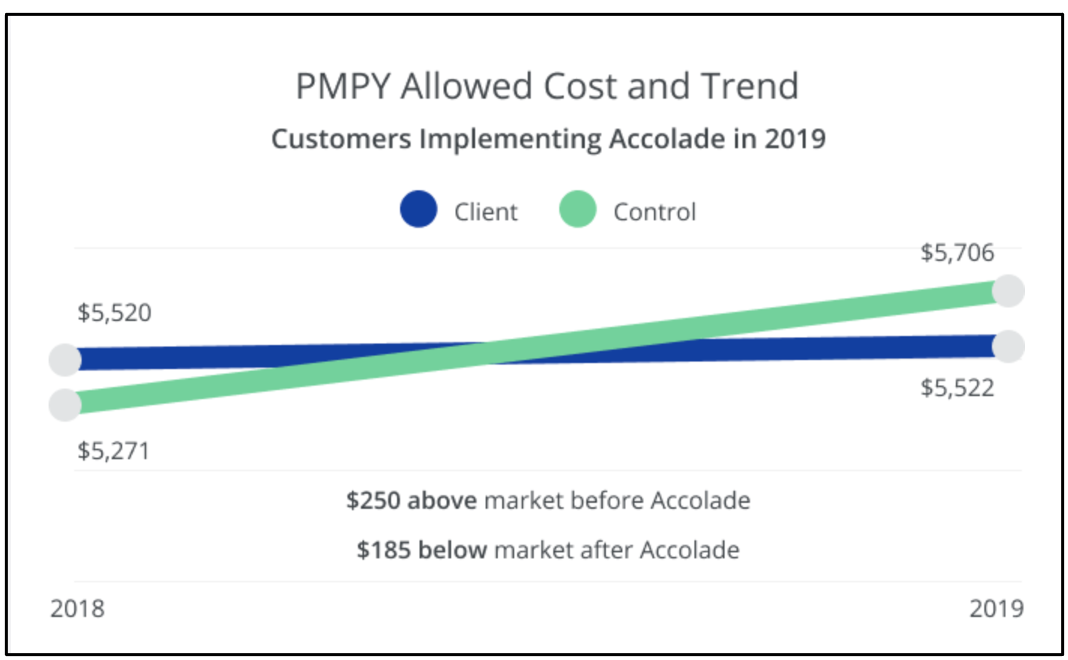
To begin with, here is Aon’s trend vs. the sample Accolade clients:

We’re not calling Aon liars, or saying that Accolade’s payments to Aon create a conflict of interest for Aon’s consultants, or saying that Accolade chose Aon instead of the much less expensive and more credible Validation Institute, which backs its validations with a unique Credibility Guarantee, because they wanted Aon’s actuaries to fabricate savings. (The Validation Institute would have to pay out on a ton of Credibility Guarantees if they fabricated savings.)
Quite the contrary, we’re sure that Accolade wanted Aon to publish results that were completely on the level. That’s why they paid them so much money, to check and double-check their work.
Every single disease category
Even so, as we pore through Aon’s report, we can’t help but see some questions that you might want to ask, just out of idle curiosity. By way of background, Accolade is a care coordination/navigation company. If you have an issue, like whether something is covered (benefits questions being the majority of the incoming phone calls), you could call them. They might be helpful. Come to think of it, they are so helpful that — get ready — they save money in every single disease category:

Accolade seems to save substantial sums of money in mental categories — “mental anxiety” and “mental mood” (as opposed to physical anxiety and physical mood, I suppose) — because massive numbers of mentally anxious and mentally moody employees are apparently calling them.
Hmmm…
Just suppose for a minute that you were mentally anxious or mentally moody? Would your first impulse would be to call a random number on the back of your insurance card and take a stranger’s advice to save your employer money? That course of action wouldn’t jump to my mind in that situation. But maybe that’s just me. So your question might be:
What do you tell these mentally anxious and mentally moody callers that saves all this money?
Maybe they advise these anxious and moody callers to stop spending money on therapists or meds, and instead just tell them to, respectively, calm down or cheer up. A few other categories might raise questions too, like:
How do you save money in “Upper GI/Esophagus”? Do employees call you and say: “My esophagus is acting up again”?
And that brings us to cancer, where the mind-blowing 18% savings explodes still farther, in another chart showing 2 years of data, to 26%. How do you save 26% in cancer? On average you would be telling every employee — including the 38% to 50% who (according to Accolade) never call even with minor administrative claims issues — not to bother with that fourth round of chemo. And I’m sure they’ll trust Accolade’s judgment on that.
Every single comorbidity/risk category
Aon’s actuaries also sliced the data by number of comorbidities. Initially, they did not show savings in every single comorbidity category. For some reason they struck out with employees who have 3 comorbidities.

We’ll blow up the right-hand “Cost Ratio” column — meaning the % savings — for you:

You could ask:
Why do your phone-answerers do such a great job on people with two or four comorbidities, but strike out on people with three?
And, my personal favorites are about people with, respectively, 0 or 1 chronic conditions:
How do you save 8% on people with (1) zero chronic conditions, (2) no reason to call Accolade, and (3) who already spend less than $2000/year on healthcare to begin with?
How do you save 9% on people with only 1 chronic condition, like maybe mental anxiety or mental moodiness, or perhaps a cranky esophagus?
Accolade/Aon’s answer to these questions on page 15 of their report is:
Only the results for members with 0 or 1 chronic conditions represented statistically credible reductions vs. market controls.
Wait…are they claiming savings only in the cohorts where there was basically no savings to be claimed? Surely not even Aon’s actuaries could be that stupid.
And yet, when you combine the 2,3 and 4 condition categories into one bar, and do the same with the 0 and 1 condition categories, it turns out that they are saying there is no difference at all between the cohorts who could have benefited from a call to Accolade, vs. the ones with no reason to call. (OK, there is a difference – 0.1%.)
Before you assume this is a textbook example of trend inflation, you might ask:
How is it that you save roughly the same amount on the healthiest employees as on the sickest employees?
Surely the data is accurate — if you pay actuaries that much money it should be — but a cynic might expect that care coordination/navigation would be more effective where there is actually the need/opportunity to coordinate/navigate care. Just sayin’…
Every Single resource use category (almost)
Finally, Aon cut the data by resource use.

The good news is that Accolade is keeping patients from using healthcare services, thus saving money in every category of utilization. There is 11% less inpatient use. Outpatient and physician expense declined as well. So another question might be:
Where are you sending employees to get their care?
By contrast, check page 147 of Why Nobody Believes the Numbers. There is an example from Quantum Health where inpatient use declined, but lower-cost resources like doctor visits increased. That increase is a “plausibility check” on Quantum’s shockingly valid claim to have reduced overall spending. Their claim would not have been plausible if every category of resource use declined. As the book says: “if you insulate your house, you’ll save money, but not on insulation.”
The best news? At the very end, Accolade broke their streak of 16 diseases, 4 comorbidity categories, and 5 resources showing savings –by getting a whopping $13 more generic drug use per employee. So, to paraphrase the immortal words of the great philosopher BIll Murray, they’ve got that going for them.
What does Aon have to say about all this?
Initially, they proudly announced the initial “savings” on the Healthcare Hackers group. (Ping me at al@quizzify.com if you want to join that group.) When I and others humbly pointed out just a few of these questions about their analysis, Aon’s Jim Winkler replied that they “stand by” their results.
I learned long ago with the wellness industry not to bother to try to argue with these people because you can’t prove something to someone who just got paid a zillion dollars to “validate” the opposite. So I simply offered to bet a million dollars their results wouldn’t stand up to scrutiny from a panel of reputable health economists.
And that’s when they folded. Not a peep out of them, though other people on the Hackers also asked. And then I noticed that Aon’s chief actuary looked at my linkedin profile.

Never heard from him either, to collect his $1 million. I guess he decided that instead of “standing by,” he should swallow hard and tacitly admit he goofed. (We will assume for now these were all honest mistakes. The way you’ll know is that, having now seen this posting, they will correct their errors.)
Speaking of swallowing hard, if you’re finding Aon’s analysis tough to swallow, you may be right. And you should also call Accolade to fix your esophagus.
Want a vendor that validly puts its fees 100% at risk for any combination of valid savings and employee engagement you choose? Who you gonna call?