
Home » Posts tagged 'wearables outcomes'
Tag Archives: wearables outcomes
Dee Edington Drains The Life Out Of The Vitality Group’s Distortion Of His Work
The Vitality Group
Short Summary of Company:
“Vitality is an active, fully integrated wellness program designed to engage your employees on their Personal Pathway to better health. Employers can choose to introduce the Vitality experience with one of our comprehensive plans. Activate is designed to bring wellness into the workplace. Elevate includes all the components of Activate, plus additional engagement features.”
Materials Being Reviewed
The Vitality Group “wearables at work” presentation. This presentation describes the health risk reduction achievable through engaging members at workplaces by wearing activity trackers.
Summary of key figures and outcomes:

Questions for Vitality Group:
You appear to be claiming that people who are “not active” reduced their risk factors simply by being engaged, without actually doing or reporting anything. A health services researcher might say that instead of taking credit for both the 6-point decline in the study group and the 5-point decline in the de facto control group risk, in reality only the difference between the two groups (1 point) could be attributable to fitness activities. If you disagree, can you explain exactly what it is that makes people in the inactive group so successful even if they don’t do anything?
ANS:
The amount that could be attributable to fitness activities is the difference between the two groups compared. For clarification, we compared (1) individuals who were engaged in fitness activities with the Vitality program (who might also be using other program elements), with (2) those who were engaged in the Vitality program on other elements but were not recording fitness activities directly with us.
So the graphic focused only on the incremental difference between the described fitness and non-fitness cohorts. Both the fitness and non-fitness cohorts were participating in other aspects of the Vitality program to track and improve their health, but the non-fitness group did not record their fitness activities through Vitality. Individuals in the non-fitness group may also have engaged in some fitness activities but simply did not log any of these activities through the Vitality program.
Observation::
Thank you for that clarification. When I look at the “difference between the two groups compared” I am seeing a 5-point decline in the first group and a 6-point decline in the second group, netting out to 1% as an “incremental difference,” rather than the 13% and 22% declines you claim,, but perhaps readers will see it differently.
How does your claim of success adjust for dropouts, and the likelihood that dropouts would have worse performance than people who were willing to be measured twice?
ANS:
This analysis did not include an adjustment for dropouts as the intent was not to make assumptions about unknown risk factors. A more detailed investigation could include this as a refinement.
Are you familiar with the concept of the “natural flow of risk” described on this slide researched and prepared by the “father of wellness measurement,” Dee Edington?
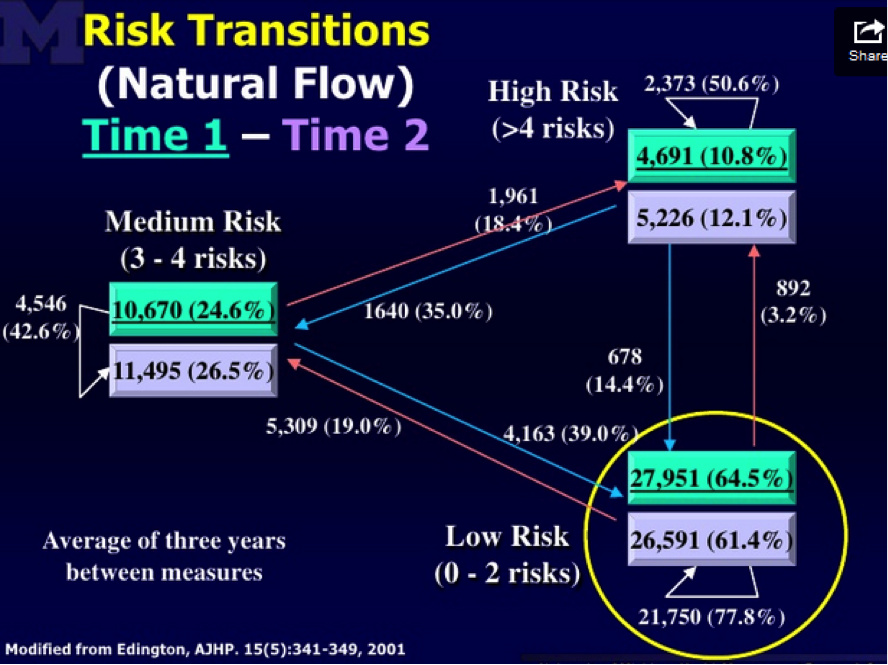
Edington’s research shows that nearly 50% of people with >4 risk factors will eventually move to a lower risk category on their own. Having been exposed to this “natural flow of risk” data, do you still believe that the non-active and active members (both groups were selected on the basis of having >4 risk factors) declined in risk due to the program, or else could some or all of the decline be due to (a) self-selection into the active group; (b) ignoring discouraged dropouts; and (c) the natural flow of risk?
Response:
Yes, we did allow for this effect by looking at the net changes in overall risk groupings by level of activity in the Vitality program. In other words, the percentages shown account for the overall flow of risk, including those who improved over the period but also those who deteriorated. The graphic focused on the proportion of high risk people in each group, but did allow for people moving into the group over the period.
Dee Edington’s work found that expected natural migration is actually a deterioration in risk groups as people naturally flow to high risk.
Often there is a tendency in wellness to compare consistent cohort risk transitions to these expected natural migration increases. Although both cohorts in the analysis saw an overall net improvement in risk groups, this comparison to natural migration was not the intent of this analysis. Instead the intent was to compare the relative changes in the two cohorts. This analysis showed that the cohort who engaged in fitness activities through Vitality had a lower proportion of high risk individuals as of their first risk measure, but had a greater net improvement in risk groups as of the last measure than those who did not engage in fitness activity through Vitality
Observation:
Hmm…well we can’t both be right. I’m looking at the exact same Dee Edington slide you are, but I am seeing the population’s risk “naturally flow” in both directions, not just “a deterioration in risk groups as people naturally flow to high risk.” Obviously the validity of the alleged declines in your cohorts is dramatically different depending on whether one uses your interpretation of Dr. Edington’s work (in which case your results are outstanding) or mine (in which case except for 1%, they are due to the natural flow downward of the highest-risk segment).
Like Alvy Singer did with Marshall McLuhan in Annie Hall, I took the liberty of asking Dee Edington himself to referee our disagreement. This is his response:
“The correct interpretation of that slide and of my work is that the natural flow of risk in a population moves in both directions, and must be understood in order to gauge impact of an intervention. It is not valid to simply start with people who were high-risk and claim credit for all risk reduction in that cohort while ignoring people who migrate in the other direction.”

