
How Quizzify prevented another hospitalization – my own

For the second time in four years, Quizzify saved me a world of hurt. This time around was thanks to our Doctor Visit PrepKits, our companion app to Classic Quizzify, our healthcare trivia quizzes.
While the quizzes teach health literacy between clinical visits, the PrepKits teach health literacy specifically for clinical visits. You just enter a keyword, like a symptom, and the PrepKits tell you what you need to know, how to prepare for your visit, questions to ask the doctor and much more.
You might say “Well, our employees can just google on symptoms or ask their doctor.” Unfortunately, if I had just googled on “Swollen calf,” the first hit would be “no cause for concern.” (Try it.) And my doctor was quite convinced the PrepKits’ take on “swollen calf” was rather alarmist, but agreed to see me anyway.
Bottom line: Absent Quizzify2Go’s admittedly alarmist but nonetheless quite accurate advice that I should seek care urgently, I would have ended up in the hospital, with a procedure and a six-month recovery.
See how Quizzify once again saved the day…and turned a likely tale of woe into a minor inconvenience.
https://www.quizzify.com/post/how-quizzify-may-have-saved-my-life-again
And then imagine how many of your employees might have a similar experience. All you need is one, to pay for all of Quizzify.
PS Please put comments on Linkedin – I’ve migrated all the comments there.
Share this:

Will the Real Kate Baicker of the Harvard School of Public Health Please Stand Up?
By Al and Vik
Harvard Professor Katherine Baicker is arguably the most acclaimed health policy researcher at arguably the most acclaimed (and not even arguably, the best-endowed) school of public health in the country. Her seminal account of the effect of Medicaid coverage on utilization and health status is a classic. As luck would have it, in 2008 Oregon used a lottery to ration available Medicaid slots. A lottery controls for motivation and as such eliminates participant-non-participant bias, since everyone who enters the lottery wants to participate. That meant only one major variable was in play, which was enrollment in Medicaid or not.

Wellness ROI claims appear lost in space
Chance favors the well-prepared, and Professor Baicker jumped on this research windfall. She found that providing Medicaid–and thereby facilitating access to basic preventive medical care–for the previously uninsured did not improve physical health status, but did increase diagnoses and utilization. Because of the soundness of the methodology, the conclusion were unassailable – more access to medical care does not improve outcomes or optimize utilization, which is a proxy for spending. (We ourselves reached a similar conclusion based on a similar analysis on North Carolina Medicaid’s medical home model.)
Yet Professor Baicker herself used exactly the opposite methodology to reach the exact opposite conclusion for workplace wellness. And that’s where the identity crisis begins.
She and two colleagues published a meta-analysis in 2010 of participant-vs-non-participant workplace wellness programs. Somehow—despite her affinity for Oregon’s lottery control—she found this opposite methodology to be acceptable. She concluded that workplace wellness generated a very specific two significant-digit 3.27-to-1 ROI from health care claims reduction alone, with another 2.37-to-1 from absenteeism reduction. The title of the article–now celebrating its fifth anniversary as the only work by a well-credentialed author in a prestigious journal ever published in support of wellness ROI—was equally unambiguous: Workplace Wellness Can Generate Savings.
This article wasn’t just an academic exercise. It gave the Obama administration academic cover for what has proven to be the most unpopular, dishonest, and even hazardous component of the Affordable Care Act: allowing employers to financially and clinically punish employees with coercive directives to lose weight, get unnecessary checkups, and answer intrusive, distasteful, and counterproductive questions about (for example) checking their testicles.
Professor Baicker did not question her too-good-to-be-true conclusion. Yet the Law of Diminishing Returns clearly contradicts her finding. Compelling privately insured people to get more healthcare is very unlikely to improve health status and reduce healthcare expense if provision of basic insurance to a medically needy population doesn’t noticeably improve health status while increasing healthcare expense.
Instead, she reveled in the limelight, receiving 307 citations, vs. 18 and 9 for two other Health Affairs articles on wellness that didn’t support more spending on vendors and consultants. (Even 307 citations aren’t enough to satisfy one of the leaders of the wellness movement, Larry Chapman, who says this study should be cited much more frequently since it’s basically the one that supports the entire industry.) However, at some point in 2013, overwhelming evidence totally invalidated her findings. At that point – like Dee Edington and Al Lewis, both of whom had previously reversed positions when the data didn’t support their previous positions—she could have acknowledged that her initial findings had been wrong and moved on.
Instead, she neither defended her position nor clearly refuted it, choosing instead a yin and yang middle ground that shifted with every interview. The metamorphosis from Queen of Significant Digits into the Queen of Significant Doubt started in July 2013, when she announced on NPR’s Marketplace that “it’s too early to tell” if wellness saves money, and that employers need to “experiment” with these programs to “see what happens to participants’ weight and blood pressure.” Right there, she invalidated herself. First, by then she certainly knew that a participants-vs-non-participants methodology was invalid since the key “smoking gun” slide in our Health Affairs posting was already widely circulated and her own opposing Oregon methodology was being widely praised. Second, even if she is right, the financial payoff for the modest “weight and blood pressure” improvements that the best programs might generate is 10-20 years in the future — and even then only if the improvements are sustained.
But then came another personality change.
In February 2014, she blamed readers for focusing on her attention-grabbing headline, the certainty of her two significant digits, and the gist of the conclusion…while ignoring the fine print, such as a caution about publication bias. Publication bias? You think? Start with the standard publication bias that negative articles rarely get published because they don’t get cited and hence reduce the all-important “impact factor” – recall the difference in Health Affairs citations in her own wellness article vs. the others.
Add to that a publication bias specific to those journals: most of the articles comprising her meta-analysis were published in third-tier journals. Among them, these journals have exactly once published an article critical of wellness (twice if you include a book review by the esteemed Norton Hadler, whom a third-tier journal is thrilled to publish regardless of what he says, and three times if you include publication of an article by a graduate student at the University of Tasmania that accidentally undercut the true believers’ own storyline, that they are now having to explain away).
Weeks later, a totally different personality emerged: she told the editor of Insurance Thought Leadership that she no longer focused on wellness and consequently has no opinions to share. Leaving aside the irony that the wellness true believers continue to cite as gospel someone who says she has no interest in what they are citing her for, this spin further invalidates her next comment, delivered in December 2014 – when suddenly, as a result of yet another personality change, she has opinions again. She told All Things Considered: “It could be that when the full set of evidence comes in, [wellness] will have huge returns on investment.”
Oops. First, she has just admitted she doesn’t follow wellness, so why speculate on future studies she has no knowledge of in a field she’s not involved in? Second, there is a rule of thumb in epidemiology: the bigger the impact, the smaller the sample size needed to discern it. An example would be smoking and lung cancer, a previously very rare disease whose cause was discernable from a handful of cases. A sample of only hundreds of veterans was needed to prove that very high blood pressure causes strokes, and studies of exercise almost always show either a physical or emotional benefit, even in small groups of people with significant disease. On the other hand, there have been probably close to a half-billion employee-years of wellness with nothing to show for themselves except results going the other way and a bunch of self-invalidating vendor lies.

Available now at Amazon.com
So we are going to make a radical proposal to the true believers: you can continue to cite Katherine Baicker but must also note that she herself no longer supports the study you are citing — until and unless she says she does. In exchange for this disclosure, when do you cite her, we will acknowledge that you are telling the truth for a change.
Share this:

Ron Goetzel and Co-Authors Claim Workplace Wellness Evidence That a CSI Couldn’t Find
Questions for Ron Goetzel and co-authors based on September 2014 article
Category: Wellness
Short Summary of Goetzel Article’s Marketing Claim:
“Evidence accumulated over the past three decades shows that well-designed and well-executed programs that are founded on evidence-based principles can achieve positive health and financial outcomes.”
(This study was paid for by American Specialty Health, a successful and well-regarded company in the alternative network business that also, not surprisingly, has a wellness subsidiary.)
Materials Being Reviewed:
The study in question appeared in a recent issue of the Journal of Occupational and Environmental Medicine.
Most of these questions were originally asked by Jon Robison of Salveo Partners, in this post.
Questions for Ron Goetzel (who has not answered any relevant follow-up question asked of him about his Koop Award either, meaning now he has forfeited $2000 in honoraria)
Is it ethical to claim “no conflict of interest” in writing this article when a wellness company paid you for it and when you and most co-authors make their living in the wellness industry?
ANS: Refused to answer
Can you explain your reasoning for listing (see below) the Koop Award-winning State of Nebraska as a “best practice wellness program” after they admitted lying about saving the lives of cancer victims who never had cancer, and after it turned out their savings figures were clinically and mathematically impossible, and after it was exposed that the state’s wellness vendor sponsors the Koop Award?

ANS: Refused to answer
Why didn’t you disclose that literally none of these “best practice” programs (especially Nebraska’s, which deliberately waived all age-related cancer screening guidelines) follow US Preventive Services guidelines and therefore companies that follow these best practices on balance are more likely to harm their employees through overdiagnosis than benefit them?
ANS: Refused to answer
You describe (among others) a Procter & Gamble study from two-decade-old data as “recent”. Can you define “recent” ? Can you name anyone at Procter & Gamble who even remembers this “recent” study?
ANS: Refused to answer
Why do you still cite Larry Chapman’s 25%-savings-from-wellness-programs allegation even though readily available online government data below shows wellness-sensitive medical events account for only 8.4% of a typical employer’s hospital cost (about 4% of total employer spending), thus making it impossible to save 25%?

ANS: Refused to answer
Why are you still citing Prof. Baicker’s article when she herself has backed off it three times, it’s never been replicated, and all attempts to replicate it, including the most recent attempt to replicate it (in the “American Journal of Health Promotion”), have shown the opposite and she herself says “there are very few reliable studies to confirm the costs and the benefits”?
ANS: Refused to answer
How can you cite RAND’s negative article as supporting the conclusion that “wellness can achieve positive financial outcomes” even though the author Soeren Mattke has specified that the modest health improvements among active participants produced no “positive financial outcomes”?
ANS: Refused to answer
Likewise, how can you cite the Pepsico health promotion study in Health Affairs in support of that same conclusion when that study concluded exactly the opposite: that health promotion had a negative ROI?

ANS: Refused to answer
Guest question submitted by Dr. Jon Robison: On p 931 you say that the RAND study found weight reduction — of course, only on active participants, excluding dropouts and non-participants — that was “clinically meaningful” and “long-lasting.” How does that square with this slide from that very same RAND study showing exactly the opposite? (Since this chart may be difficult to read,we’ll highlight the key finding, which was that by the 4th year the average active participant had sustained weight loss of only a few ounces.)
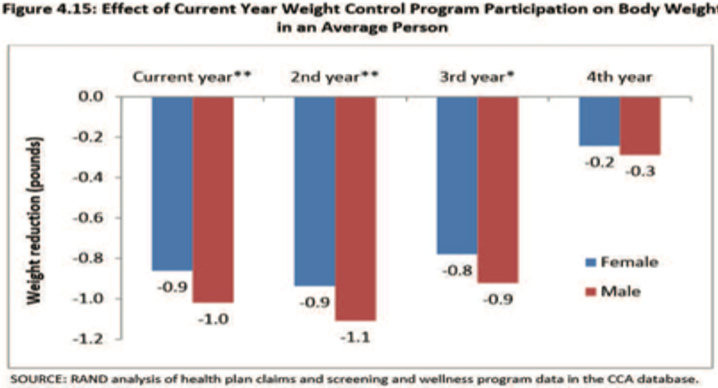
ANS: Refused to answer
Share this:

Orriant publishes wellness data in Journal of Workplace Health Management and no one cares
Orriant, Ray Merrill
Category: Wellness
Short Summary of Company’s Marketing Claim:
“A New Scientific Study Proves Wellness Works”
Materials Being Reviewed:
http://www.orriant.com/File/4072ee6c-2bcd-43a5-83b6-e9035c8c0f1a
Questions for Orriant and Ray Merrill:
When you say “a new internationally-published study proves wellness works,” are you taking into account that the “international” journal publishing the work has a Zero impact factor, meaning that essentially no one believes anything they publish has enough value to cite?
ANS: Refused to answer
Are you attributing the fact that “participants had fewer health claims than non-participants” to your program, rather than to the obvious non-observable variable that participants are motivated whereas non-participants are not?
ANS: Refused to answer
Are you familiar with Health Fitness Corporation’s demonstration that participants will outperform non-participants even in the absence of a program? (See the year 2005 below — no program but participants outperformed non-participants nonetheless.)
ANS: Refused to answer
You also note that “those with the greatest health risks” had the most improvement.” Are you familiar with Dee Edington’s work that says those with the greatest health risks will improve the most even in the absence of a program, due to the natural flow of risk?
ANS: Refused to answer
Non-participants’ medical costs were “2.9x greater” (about $4000 vs. about $1400). This, of course, is the record for the hugest savings ever claimed from a wellness program. Since government data shows that wellness-sensitive medical events account for only 4% of total costs or about $200/person, where did the other $2400/person in savings come from?
ANS: Refused to answer
Why didn’t the authors plausibility-check the entire population using a wellness-sensitive medical event analysis?
ANS: Refused to answer
Share this:

Interactive Health
The Interactive Health case study has been removed from the “Smoking Guns,” because it has so many obvious errors that we use it instead as the “issue spotter” for the advanced-level course and certification in Critical Outcomes Report Analysis.
I also wouldn’t trust them as my wellness vendor even if they didn’t make up outcomes. I had the misfortune of attending one of their screens. They “screened” me for calf tightness. It turns out my calves are tight. Admittedly, I can see why tight calves could impact productivity for some employees. (Example: first basemen.) And I could just feel my own productivity soaring after they loosened them up…until the left one went into spasm that night.
It also would be nice, assuming they are going to do these screens, to actually send people their results without being reminded four or five times.
Share this:

Viverae wellness primes its own pump for an EEOC wellness lawsuit
Viverae
Category: Wellness
Short Summary of Company:
“Viverae gives our clients a platform for managing healthcare costs by motivating their employees to make healthy choices. Our comprehensive wellness programs address your organization’s goals to meet your employees where they are.”
Materials Being Reviewed:


Questions for Viverae:
General: What customers have actually signed up for this and are willing to admit it?
ANS: Refused to answer
Provision #2: Since your biometrics are out of compliance with USPSTF guidelines, wouldn’t a customer be risking an EEOC lawsuit by “requiring” every employee to do this against their will, subject to a large fine?
ANS: Refused to answer
Provision #4: Isn’t this the same as saying “If you sign up for two years, we’ll give you a third year maybe at a 20% discount if you do everything perfectly, but by doing so you waive your right to cancel after one or two years” ?
ANS: Refused to answer
Provision #5: Has any customer of Viverae or any other wellness vendor with 1000 or more employees completed HRAs and submitted to biometric screens at a 100% rate, as you require in Provision #2?
ANS: Refused to answer
Provision #6: How could a health plan get a positive return on this program by offering people $720 apiece, when wellness-sensitive medical events account for less than $200/person in claims spend?
ANS: Refused to answer
Speaking of Provision #6, if your very own website says savings are $500/person (I’d be curious what legitimate academic research supports that), how can you guarantee savings when the cost of the incentive alone is $720?
ANS: Refused to answer
Share this:

Did you know 100% of your employees have chronic disease? Wellsource says so!
Wellsource
Short Summary of Company:
“Wellsource pioneered the concept of computer-assisted wellness. Today, more than 30 years later, Wellsource continues to offer innovative, evidence-based health assessments and online wellness tools that improve lives and contribute to a healthy bottom line.”
Materials being reviewed:

Questions for Wellsource
How is it that 100% of the employees at this company have a chronic disease?
ANS: Refused to answer
If “cancer” were a chronic disease as you claim it is, like diabetes or heart disease or asthma, how come no one ever says: “I have lung cancer, but my doctor says we’re staying on top of it”?
ANS: Refused to answer
If “stroke” were a chronic disease as you claim it is, how come every minute you don’t get to the ER following a stroke increases the odds you’ll end up like the Kardashians? Wouldn’t “stroke” be the epitome of an acute event rather than a chronic disease?
ANS: Refused to answer
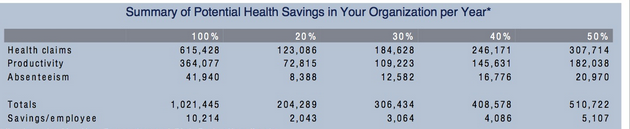
If all these people are so sick, how come the largest opportunity per employee to save money ($40,000/employee!) is to get a few more people to buckle their seatbelts 100% of the time instead of 95% of the time?
ANS: Refused to answer
Speaking of seat belts, does it increase your credibility with potential purchasers that seat belt use is expressed the wrong way (96% buckle, meaning the correct figure to enter here would be “4%,” the ones who don’t always buckle)?
ANS: Refused to answer
If a whopping 89% of your employees have high blood pressure as defined by 140/90, do you think there is a chance you made a mistake in measuring this variable?
ANS: Refused to answer
How can you save $6154.28 per employee in health spending just on these items when the average employee doesn’t spend $6154.28 in healthcare costs altogether?
ANS: Refused to answer
How is this $6154.28 savings/employee figure (expressed in your materials as $615,428 for the 100 employees in this company) consistent with sourcing Steve Aldana, who claims that you always save $1358.85 per employee, whether you get a 0% improvement or a 100% improvement in risk factors?
ANS: Refused to answer
Share this:

Milliman Magic Saves North Carolina More Medicaid Money Than Was Actually Spent
Milliman, Community Care of North Carolina
Short Summary of Intervention:
Increase payments to providers and add EMRs and add case managers in the hopes of reducing admissions and emergency room expenses
Links to and List of Materials Being Reviewed:
- Milliman Cost Savings Report
- Questioning the Widely Publicized Savings Reported for North Carolina Medicaid


Summary of key figures and outcomes:
- $177-million savings in 2007 in children’s admissions alone, increasing in the years after that
- Increase in costs of program more than offset by admissions reduction
Questions for Community Care of North Carolina:
The CCNC website says CCNC is “saving money” and yet the federal government data above notes that North Carolina Medicaid’s costs are between 24% and 40% higher than the costs in surrounding states. How is this “saving money”?
ANS: Refused to answer
North Carolina has suffered cost overruns amounting to more than a billion dollars just since CCNC became the provider for almost all non-disabled adults and children in the state. How is that track record consistent with “saving money”?
ANS: Refused to answer
Why did you hire consultants — and pay them more taxpayer money than any other consultants had ever been paid to do this work — who had never done this type of analysis before and didn’t even realize that the answers were already online?
ANS: Refused to answer
Questions for Milliman:
How is it possible to save at least $177,000,000/year starting in 2007 in children’s admissions when the government’s own data collected expressly for the purpose of studies like these shows you only spent $114,000,000 in 2006?
ANS: Refused to answer
Your defense has been that 2006 was not the baseline. However, the years prior to 2006 all show spending figures lower than $114,000,000. So which year was the baseline?
ANS: Refused to answer
You have also said that there is no baseline period. Can you point us to any other study in any reputable journal which did not have a baseline period?
ANS: Refused to answer
Why did you suppress all the government data above that completely contradicted your findings, or did you not know the government collected this data both on comparative per capita costs and on admissions by age group and payer?
ANS: Refused to answer
If you did not know about this online data, shouldn’t you be changing your conclusions and/or returning North Carolina taxpayers their money?
ANS: Refused to answer
If you thought this authoritative government data showing the opposite was irrelevant or wrong, could you explain why?
ANS: Refused to answer
Were you aware that Mercer’s previous study for North Carolina was also thoroughly discredited for not using that government data and thereby coming up with an impossible answer (the study has quietly been removed from the Community Care of North Carolina website as a result)?
ANS: Refused to answer
If surrounding states have similar Medicaid programs and most North Carolina children were already in CCNC, why not just take advantage of that “natural control” and compare the state as a whole to other states, especially because the federal data mentioned above had already been collected for all those states?
ANS: Refused to answer
In your Letter to the Editor following publication of the above article questioning your savings, which consisted of four questions about the savings calculation, why you didn’t answer any of the four questions the article asked?
ANS: Refused to answer
The very first page of your report says the decline in admissions more than offset the increases in other categories, thus netting out to the massive savings you calculated. Yet after it was shown that admissions did not decline at all, you said in your Letter to the Editor that the decline came from “categories other than admissions.” Which is it – admissions accounted for more than 100% of the net savings, offset by other categories, or other categories accounted for all the savings?
ANS: Refused to answer
Page 19 of your report says “other Milliman consultants may hold different views.” If members of your own organization wouldn’t agree with you, why should others agree with you when you suppressed data, contradicted yourself, and found mathematically impossible savings?
ANS: Refused to answer
Admission rates in the specific disease categories CCNC was focused on — asthma and diabetes — underperformed surrounding states. In diabetes admissions actually increased on an absolute basis. Where did the savings come from if not from the targeted conditions?
ANS: Refused to answer
Share this:

Dee Edington Drains The Life Out Of The Vitality Group’s Distortion Of His Work
The Vitality Group
Short Summary of Company:
“Vitality is an active, fully integrated wellness program designed to engage your employees on their Personal Pathway to better health. Employers can choose to introduce the Vitality experience with one of our comprehensive plans. Activate is designed to bring wellness into the workplace. Elevate includes all the components of Activate, plus additional engagement features.”
Materials Being Reviewed
The Vitality Group “wearables at work” presentation. This presentation describes the health risk reduction achievable through engaging members at workplaces by wearing activity trackers.
Summary of key figures and outcomes:

Questions for Vitality Group:
You appear to be claiming that people who are “not active” reduced their risk factors simply by being engaged, without actually doing or reporting anything. A health services researcher might say that instead of taking credit for both the 6-point decline in the study group and the 5-point decline in the de facto control group risk, in reality only the difference between the two groups (1 point) could be attributable to fitness activities. If you disagree, can you explain exactly what it is that makes people in the inactive group so successful even if they don’t do anything?
ANS:
The amount that could be attributable to fitness activities is the difference between the two groups compared. For clarification, we compared (1) individuals who were engaged in fitness activities with the Vitality program (who might also be using other program elements), with (2) those who were engaged in the Vitality program on other elements but were not recording fitness activities directly with us.
So the graphic focused only on the incremental difference between the described fitness and non-fitness cohorts. Both the fitness and non-fitness cohorts were participating in other aspects of the Vitality program to track and improve their health, but the non-fitness group did not record their fitness activities through Vitality. Individuals in the non-fitness group may also have engaged in some fitness activities but simply did not log any of these activities through the Vitality program.
Observation::
Thank you for that clarification. When I look at the “difference between the two groups compared” I am seeing a 5-point decline in the first group and a 6-point decline in the second group, netting out to 1% as an “incremental difference,” rather than the 13% and 22% declines you claim,, but perhaps readers will see it differently.
How does your claim of success adjust for dropouts, and the likelihood that dropouts would have worse performance than people who were willing to be measured twice?
ANS:
This analysis did not include an adjustment for dropouts as the intent was not to make assumptions about unknown risk factors. A more detailed investigation could include this as a refinement.
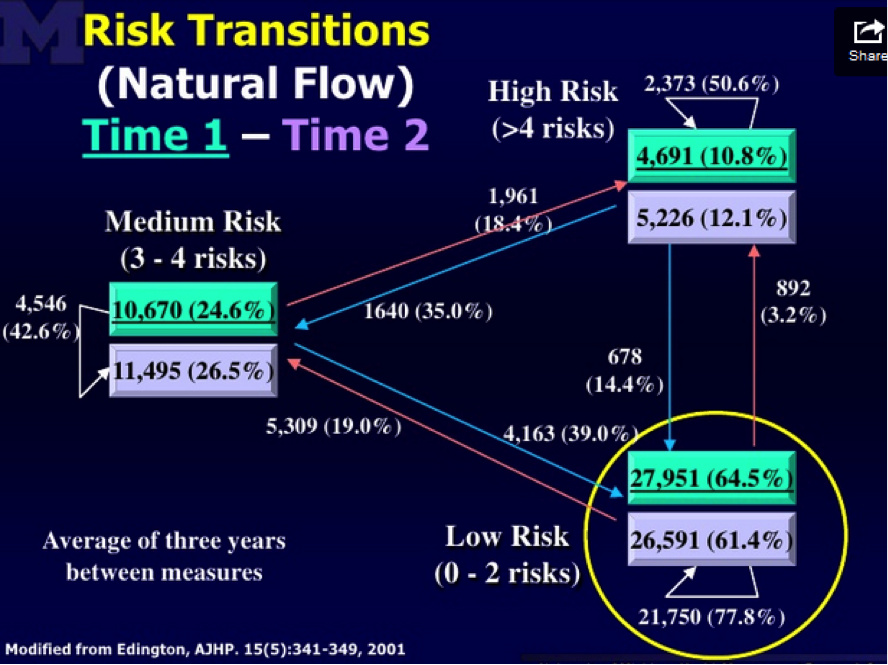
Are you familiar with the concept of the “natural flow of risk” described on this slide researched and prepared by the “father of wellness measurement,” Dee Edington?
Edington’s research shows that nearly 50% of people with >4 risk factors will eventually move to a lower risk category on their own. Having been exposed to this “natural flow of risk” data, do you still believe that the non-active and active members (both groups were selected on the basis of having >4 risk factors) declined in risk due to the program, or else could some or all of the decline be due to (a) self-selection into the active group; (b) ignoring discouraged dropouts; and (c) the natural flow of risk?
Response:
Yes, we did allow for this effect by looking at the net changes in overall risk groupings by level of activity in the Vitality program. In other words, the percentages shown account for the overall flow of risk, including those who improved over the period but also those who deteriorated. The graphic focused on the proportion of high risk people in each group, but did allow for people moving into the group over the period.
Dee Edington’s work found that expected natural migration is actually a deterioration in risk groups as people naturally flow to high risk.
Often there is a tendency in wellness to compare consistent cohort risk transitions to these expected natural migration increases. Although both cohorts in the analysis saw an overall net improvement in risk groups, this comparison to natural migration was not the intent of this analysis. Instead the intent was to compare the relative changes in the two cohorts. This analysis showed that the cohort who engaged in fitness activities through Vitality had a lower proportion of high risk individuals as of their first risk measure, but had a greater net improvement in risk groups as of the last measure than those who did not engage in fitness activity through Vitality
Observation:
Hmm…well we can’t both be right. I’m looking at the exact same Dee Edington slide you are, but I am seeing the population’s risk “naturally flow” in both directions, not just “a deterioration in risk groups as people naturally flow to high risk.” Obviously the validity of the alleged declines in your cohorts is dramatically different depending on whether one uses your interpretation of Dr. Edington’s work (in which case your results are outstanding) or mine (in which case except for 1%, they are due to the natural flow downward of the highest-risk segment).
Like Alvy Singer did with Marshall McLuhan in Annie Hall, I took the liberty of asking Dee Edington himself to referee our disagreement. This is his response:
“The correct interpretation of that slide and of my work is that the natural flow of risk in a population moves in both directions, and must be understood in order to gauge impact of an intervention. It is not valid to simply start with people who were high-risk and claim credit for all risk reduction in that cohort while ignoring people who migrate in the other direction.”
Share this:

Wellnet Detects Undetected Claims Costs
Wellnet
Short Summary of Intervention:
Risk reduction program. “Our company’s focus is on exceptional execution and the manner in which health benefits are delivered and managed. Healthcare is personal and we treat it that way. Our mission to provide a level of service, collaboration and integration you will not find elsewhere in the marketplace.”
Materials Being Reviewed:

Summary of key figures and outcomes:
- 18-to-1 ROI
- $463,000 reduction ($180 per person) in medical spending, on a base of about $6 million.
- $21 million reduction in “undetected claims costs” on 55 high-risk members ($4 million) and 453 medium-risk members ($17 million).
- Medical trend reduction from 8% to 0.06%
Questions for Wellnet:
What are “undetected claims costs”? We can’t find an insurance company that has heard of them, and we can’t find any definition on Google, or even any reference to them at all, other than Wellnet’s.
ANS: Refused to answer
It’s not clear whether the 18-to-1 ROI is driven by the $180/person reduction in medical spending or the $21 million reduction in “undetected claims cost.” If the former, does that mean your wellness program only cost $10 per person?
ANS: Refused to answer
If the latter, how does the $21 million in “undetected claims costs” relate to the $6 million in detected claims costs?
ANS: Refused to answer
You list 508 medium-risk and high-risk members whose risk reduction accounted for the $21 million in “undetected claims costs.” Is it possible that many of the unmentioned 2000 employees and dependents who are low-risk might increase risk factors and therefore offset those savings, as Dee Edington’s model below would predict?
ANS: Refused to answer

By changing the axes on the graphs so that the cost bars are not drawn to scale, wouldn’t the physical difference in the height of the bars (about 50%) appear to dramatically overstate the savings (about 7.3%)? Doesn’t omitting the “$5.0” hashmark on the top graph exacerbate this effect even more?
ANS: Refused to answer
How does the 7.3% negative spending trend on the lower graph tie to the 0.06% positive spending trend claimed in the first section?
ANS: Refused to answer
On just the 55 high-risk members alone, you are saving $73,000 apiece, about 4 hospitalizations each. Can you share how this might be possible to do, through your wellness tools?
ANS: Refused to answer

