
Home » Posts tagged 'Milliman'
Tag Archives: Milliman
Milliman Magic Saves North Carolina More Medicaid Money Than Was Actually Spent
Milliman, Community Care of North Carolina
Short Summary of Intervention:
Increase payments to providers and add EMRs and add case managers in the hopes of reducing admissions and emergency room expenses
Links to and List of Materials Being Reviewed:
- Milliman Cost Savings Report
- Questioning the Widely Publicized Savings Reported for North Carolina Medicaid


Summary of key figures and outcomes:
- $177-million savings in 2007 in children’s admissions alone, increasing in the years after that
- Increase in costs of program more than offset by admissions reduction
Questions for Community Care of North Carolina:
The CCNC website says CCNC is “saving money” and yet the federal government data above notes that North Carolina Medicaid’s costs are between 24% and 40% higher than the costs in surrounding states. How is this “saving money”?
ANS: Refused to answer
North Carolina has suffered cost overruns amounting to more than a billion dollars just since CCNC became the provider for almost all non-disabled adults and children in the state. How is that track record consistent with “saving money”?
ANS: Refused to answer
Why did you hire consultants — and pay them more taxpayer money than any other consultants had ever been paid to do this work — who had never done this type of analysis before and didn’t even realize that the answers were already online?
ANS: Refused to answer
Questions for Milliman:
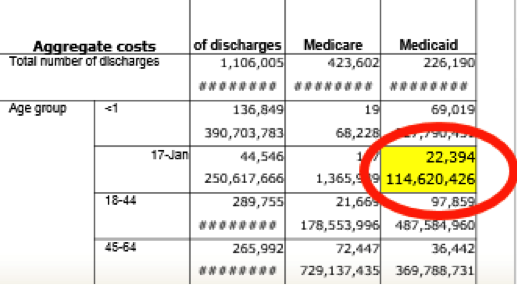
How is it possible to save at least $177,000,000/year starting in 2007 in children’s admissions when the government’s own data collected expressly for the purpose of studies like these shows you only spent $114,000,000 in 2006?
ANS: Refused to answer
Your defense has been that 2006 was not the baseline. However, the years prior to 2006 all show spending figures lower than $114,000,000. So which year was the baseline?
ANS: Refused to answer
You have also said that there is no baseline period. Can you point us to any other study in any reputable journal which did not have a baseline period?
ANS: Refused to answer
Why did you suppress all the government data above that completely contradicted your findings, or did you not know the government collected this data both on comparative per capita costs and on admissions by age group and payer?
ANS: Refused to answer
If you did not know about this online data, shouldn’t you be changing your conclusions and/or returning North Carolina taxpayers their money?
ANS: Refused to answer
If you thought this authoritative government data showing the opposite was irrelevant or wrong, could you explain why?
ANS: Refused to answer
Were you aware that Mercer’s previous study for North Carolina was also thoroughly discredited for not using that government data and thereby coming up with an impossible answer (the study has quietly been removed from the Community Care of North Carolina website as a result)?
ANS: Refused to answer
If surrounding states have similar Medicaid programs and most North Carolina children were already in CCNC, why not just take advantage of that “natural control” and compare the state as a whole to other states, especially because the federal data mentioned above had already been collected for all those states?
ANS: Refused to answer
In your Letter to the Editor following publication of the above article questioning your savings, which consisted of four questions about the savings calculation, why you didn’t answer any of the four questions the article asked?
ANS: Refused to answer
The very first page of your report says the decline in admissions more than offset the increases in other categories, thus netting out to the massive savings you calculated. Yet after it was shown that admissions did not decline at all, you said in your Letter to the Editor that the decline came from “categories other than admissions.” Which is it – admissions accounted for more than 100% of the net savings, offset by other categories, or other categories accounted for all the savings?
ANS: Refused to answer
Page 19 of your report says “other Milliman consultants may hold different views.” If members of your own organization wouldn’t agree with you, why should others agree with you when you suppressed data, contradicted yourself, and found mathematically impossible savings?
ANS: Refused to answer
Admission rates in the specific disease categories CCNC was focused on — asthma and diabetes — underperformed surrounding states. In diabetes admissions actually increased on an absolute basis. Where did the savings come from if not from the targeted conditions?
ANS: Refused to answer
Share this:

More Milliman Magic From North Carolina
Milliman, Community Care of North Carolina
Short Summary of Intervention:
Increase payments to providers and add EMRs and add case managers in the hopes of reducing admissions and emergency room expenses
Links to and List of Materials Being Reviewed
- Milliman Cost Savings Report
- Questioning the Widely Publicized Savings Reported for North Carolina Medicaid


Summary of key figures and outcomes:
$177-million savings in 2007 in children’s admissions alone, increasing in the years after that
Increase in costs of program more than offset by admissions reduction
Questions for Community Care of North Carolina:
The CCNC website says CCNC is “saving money” and yet the federal government data above notes that North Carolina Medicaid’s costs are between 24% and 40% higher than the costs in surrounding states. How is this “saving money”?
North Carolina has suffered cost overruns amounting to more than a billion dollars just since CCNC became the provider for almost all non-disabled adults and children in the state. How is that track record consistent with “saving money”?
Why did you hire consultants — and pay them more taxpayer money than any other consultants had ever been paid to do this work — who had never done this type of analysis before and didn’t even realize that the answers were already online?
Questions for Milliman
How is it possible to save at least $177,000,000/year starting in 2007 in children’s admissions when the government’s own data collected expressly for the purpose of studies like these shows you only spent $114,000,000 in 2006?
Your defense has been that 2006 was not the baseline. However, the years prior to 2006 all show spending figures lower than $114,000,000. So which year was the baseline?
You have also said that there is no baseline period. This strikes us as curious but we could be wrong: Can you point us to any other study in any reputable journal which did not have a baseline period?
Why did you suppress all the government data above that completely contradicted your findings, or did you not know the government collected this data both on comparative per capita costs and on admissions by age group and payer?
If you did not know about this online data, shouldn’t you be changing your conclusions and/or returning North Carolina taxpayers their money?
If you suppressed the data because you thought it was irrelevant, wouldn’t it have been more ethical to acknowledge the existence of the authoritative government data, but then describe why the federal government data didn’t apply and let the reader decide whether it was relevant?
Given that Mercer’s previous study for North Carolina was thoroughly discredited for not using that government data and thereby coming up with an impossible answer (the study has quietly been removed from the Community Care of North Carolina website as a result), wouldn’t it have been wise not to make that same mistake again?
If surrounding states have similar Medicaid programs and most North Carolina children were already in CCNC, why not just take advantage of that “natural control” and compare the state as a whole to other states, especially because the federal data mentioned above had already been collected for all those states?
In your Letter to the Editor following publication of the above article questioning your savings, which consisted of four questions about the savings calculation, why you didn’t answer any of the four questions the article asked?
The very first page of your report says the decline in admissions more than offset the increases in other categories, thus netting out to the massive savings you calculated. Yet after it was shown that admissions did not decline at all, you said in your Letter to the Editor that the decline came from “categories other than admissions.” Which is it – admissions accounted for more than 100% of the net savings, offset by other categories, or other categories accounted for all the savings?
Page 19 of your report says “other Milliman consultants may hold different views.” If members of your own organization wouldn’t agree with you, why should others agree with you when you suppressed data, contradicted yourself, and found mathematically impossible savings?
Admission rates in the specific disease categories CCNC was focused on — asthma and diabetes — underperformed surrounding states. In diabetes admissions actually increasing on an absolute basis. Didn’t you feel this might be a red flag to suggest that the huge savings your model was showing you might not be valid?
Share this:

Health Fitness Corp wins a Koop award for curing non-existent cancers in Nebraska
C. Everett Koop National Health Award Committee,
Wellness Council of America and Health Fitness Corp.
Short Summary of Award:
The C. Everett Koop award committee’s mission is:
“…to seek out, evaluate, promote and distribute programs with demonstrated effectiveness in influencing personal health habits and the cost effective use of health care services. These programs have the objectives of
- Providing appropriate quality care
- Sharply reducing the alarming rate of health care inflation, by holding down unnecessary expenditures.”
Materials Being Reviewed:
The brochure in question describing the Nebraska program is downloadable from the WELCOA website.
Case Study of Award Winner for 2012: Health Fitness Corporation and Nebraska
Summary of key figures and outcomes:
Alleged cancer outcomes include the following:

Risk reduction outcomes include the following:

Questions for C. Everett Koop Award Committee:
I: Alleged Cancer Outcomes
Were you troubled by the program sponsors’ decision to waive all age-related colon cancer screening guidelines established by the government, and send out 140,000 flyers, at taxpayer expense, featuring a beautiful woman much too young to have a screening colonoscopy?

ANS: Refused to answer
How come, when the program reported that 514 of the 5000 (or fewer) people screened had colon cancer (in addition to the ones who would have been screened anyway), none of the Committee members with health informatics backgrounds from Truven Health Analytics and Mercer and Milliman (and from Wellsteps and Staywell, both of whose programs are also highlighted) were concerned that this alleged 11% colon cancer rate was at least 100 times greater than Love Canal’s?
ANS: Refused to answer
When Health Fitness Corporation admitted lying and reversed their story from making “life saving, cost-saving catches” of “early stage [colon] cancer” to revealing that those 514 people didn’t have cancer, why did the Koop Committee re-endorse what would appear to be outright data falsification, instead of rescinding the award?
ANS: Refused to answer
Even if the committee is allowing Health Fitness Corporation to keep its award and not even apologize, why does this claim of “life-saving, cost-saving catches” still appear on the WELCOA website even though the lie has been admitted?
ANS: Refused to answer
Wouldn’t the fact that the perpetrator of this acknowledged lie is also a sponsor of this Koop award that its own customers have won three times (including this incident) create the perception of a conflict of interest?

ANS: Refused to answer
Does anyone on the Committee think if Dr. Koop were still alive that he would endorse your position on data falsification of cancer victims?
ANS: Refused to answer
WELCOA’s website said it was founded by someone who appears to be the inventor of the self-serve all-you-can-eat restaurant. Despite his well-deserved reputation for integrity, did he endorse data falsification of cancer victims even after the perpetrators admitted it?

ANS: Refused to answer (but did change the spelling)
II: Risk Reduction Outcomes
How do you reconcile the claimed savings figure exceeding $4-million with your own chart above showing that only 161 active participants (3.1%) reduced a risk factor? (That chart of course doesn’t include dropouts and non-participants, whose risk factors may have increased.)
ANS: Refused to answer
Dividing the total savings by 161 yields more than $20,000/person in savings. Wouldn’t that $20,000+ for each risk factor avoided imply that all 161 would have had a heart attack even though the entire eligible population only had about 30 heart attacks the previous year, while the participating population would have had about 7?
ANS: Refused to answer
How do you reconcile your statement that 40% of the population had previously undiagnosed high blood pressure or high cholesterol with your other statement that “the total number of prescription scripts [sic] filled within the Wellness Plan reduced [sic] 3% last year,” despite your reducing or waiving the copays? Shouldn’t prescriptions have gone up, if indeed 40% more people were at risk?
ANS: Refused to answer
How can you attribute the 3% reduction in prescriptions to “improved lifestyles” with the fact that your own graph shows only 161 people improved their lifestyles enough to reduce a risk factor? What happened to the thousands who were diagnosed but were neither medicated nor improved their lifestyles?
ANS: Refused to answer
How do you reconcile that same finding – that 40% had high blood pressure or cholesterol — with that same graph, showing that almost three-quarters of the population was low-risk?
ANS: Refused to answer
How do you reconcile the brochure’s claim that the “majority of employees touted how the program has improved their lives” with the brochure’s own admission that only a minority of employees (42%) even bothered to be screened once and only 25% twice despite the four-figure financial incentive?
ANS: Refused to answer
Follow-up response
Not-for-attribution response received August 1, stating that the reason the Committee let them keep their award was not because were a sponsor but rather because they did not make the life-saving claim on their application. (They did make all the other invalid claims.) Because they didn’t make the claim on the application, they are not in violation of the Committee’s ethical standards by making it in other venues.
Our reaction:
So it is OK if a ballplayer admits using steroids as long as he didn’t happen to test positive?
Follow-Up Response
September 2014: Nebraska listed as a “best practice program” by Ron Goetzel
Our Reaction:
Doesn’t this listing contradict your initial excuse — that you forgot to ask them about whether they made up their cancer statistics during your due diligence — because now you know about that lie and all the other lies in their outcomes measurement…and yet you still call them a best-practice program?

