
Milliman, Community Care of North Carolina
Short Summary of Intervention:
Increase payments to providers and add EMRs and add case managers in the hopes of reducing admissions and emergency room expenses
Links to and List of Materials Being Reviewed
- Milliman Cost Savings Report
- Questioning the Widely Publicized Savings Reported for North Carolina Medicaid


Summary of key figures and outcomes:
$177-million savings in 2007 in children’s admissions alone, increasing in the years after that
Increase in costs of program more than offset by admissions reduction
Questions for Community Care of North Carolina:
The CCNC website says CCNC is “saving money” and yet the federal government data above notes that North Carolina Medicaid’s costs are between 24% and 40% higher than the costs in surrounding states. How is this “saving money”?
North Carolina has suffered cost overruns amounting to more than a billion dollars just since CCNC became the provider for almost all non-disabled adults and children in the state. How is that track record consistent with “saving money”?
Why did you hire consultants — and pay them more taxpayer money than any other consultants had ever been paid to do this work — who had never done this type of analysis before and didn’t even realize that the answers were already online?
Questions for Milliman
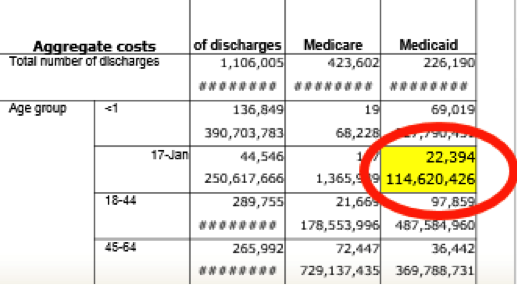
How is it possible to save at least $177,000,000/year starting in 2007 in children’s admissions when the government’s own data collected expressly for the purpose of studies like these shows you only spent $114,000,000 in 2006?
Your defense has been that 2006 was not the baseline. However, the years prior to 2006 all show spending figures lower than $114,000,000. So which year was the baseline?
You have also said that there is no baseline period. This strikes us as curious but we could be wrong: Can you point us to any other study in any reputable journal which did not have a baseline period?
Why did you suppress all the government data above that completely contradicted your findings, or did you not know the government collected this data both on comparative per capita costs and on admissions by age group and payer?
If you did not know about this online data, shouldn’t you be changing your conclusions and/or returning North Carolina taxpayers their money?
If you suppressed the data because you thought it was irrelevant, wouldn’t it have been more ethical to acknowledge the existence of the authoritative government data, but then describe why the federal government data didn’t apply and let the reader decide whether it was relevant?
Given that Mercer’s previous study for North Carolina was thoroughly discredited for not using that government data and thereby coming up with an impossible answer (the study has quietly been removed from the Community Care of North Carolina website as a result), wouldn’t it have been wise not to make that same mistake again?
If surrounding states have similar Medicaid programs and most North Carolina children were already in CCNC, why not just take advantage of that “natural control” and compare the state as a whole to other states, especially because the federal data mentioned above had already been collected for all those states?
In your Letter to the Editor following publication of the above article questioning your savings, which consisted of four questions about the savings calculation, why you didn’t answer any of the four questions the article asked?
The very first page of your report says the decline in admissions more than offset the increases in other categories, thus netting out to the massive savings you calculated. Yet after it was shown that admissions did not decline at all, you said in your Letter to the Editor that the decline came from “categories other than admissions.” Which is it – admissions accounted for more than 100% of the net savings, offset by other categories, or other categories accounted for all the savings?
Page 19 of your report says “other Milliman consultants may hold different views.” If members of your own organization wouldn’t agree with you, why should others agree with you when you suppressed data, contradicted yourself, and found mathematically impossible savings?
Admission rates in the specific disease categories CCNC was focused on — asthma and diabetes — underperformed surrounding states. In diabetes admissions actually increasing on an absolute basis. Didn’t you feel this might be a red flag to suggest that the huge savings your model was showing you might not be valid?


Um. Ages <1 are also "children," last I checked. (Granted, the government's report where "1-17" prints as "17-Jan" suggests someone needs to brush up on their Excel 101.) I can't read the admission costs attributed to infants, though, because of the Helpful Red Oval. It also appears that North Carolina counts 18, 19, and 20 year olds in their definition of children, which would be another (smallish) add-in from the H-CUP database "18-44" group.
The other Elephant in the Room that no one seems to address: not all hospital admissions are actually "hospital admissions," especially in pediatrics. Observation hospital stays (which might last 2-3 days or more) are not counted as inpatient stays in the H-CUP database. Yet many if not most of the ambulatory-sensitive pediatric hospital stays (dehydration, asthma, fever evaluations, bronchiolitis, pneumonia) are coded as observation and not inpatient. Cost savings from decreases in observation stays would have been essentially invisible on the H-CUP database — and the time period under question was about when the huge uptick began in converting patients formerly known as inpatients to obs. (see http://kaiserhealthnews.org/news/observation-care-faq/)
LikeLike
You read this very carefully. Thank you for that. A few observations. The two groups don’t overlap exactly. That is true. However, the major source of admits in 18-20 year olds in Medicaid are birth events. And I don’t think a PCMH in NC is going to want to take credit for any reduction there. And you are right that the 0-1 is in one group but not the other. However, the other has disableds.
As to your point about observation days, that was mostly a Medicare thing, but in any case, I also did the analysis of TN and SC concurrently. They almost exactly mirrored NC even without a PCMH. Whatever the impact was of observation days, it would have affected all those states equally.
We also did ambulatory-care-sensitive admits as a group. Same result. If you can come to Philadelphia on Monday, I will be presenting the whole ball of wax.
In any case, all your observations are well into the “20” of the 80-20 rule. The number of reduced admissions would have to be massive to make Milliman’s numbers add up, not slight differences due to possible non-comparable samples.
Most importantly, the Milliman consultant did admit lying, in the sense that his story changed 180 degrees after we outed him. That is the toughest data point to explain away.
By the way, my book Why Nobody Believes the Numbers has a whole chapter on NC Medicaid. You obviously have a great interest in this topic and the ability to read closely and thoughtfully (though it is largely a humor book since the perps are so hilariously wrong).
LikeLike