
US Corporate Wellness Saves Money on People Who Don’t Cost Money
Category: Wellness
Short Summary of Intervention: “The strategy? Engage… Measure… Optimize. While personal accountability must always be a central component, it is supported through personal engagement and an individualized improvement process. Rather than trying to change the core of an individual employee, we work with the individual to help create a tomorrow that is a little better than today. In doing so, the organization gleans a strong ROI while simultaneously enhancing the lives of their purported ‘most important asset.’”
Materials Being Reviewed and Summary of Outcomes


Questions for US Corporate Wellness:
How can you save $350/year on people who don’t increase factors? Most people don’t add a risk factor in most years, so wouldn’t this math mean that in a couple of decades you would wipe out healthcare spending simply by doing nothing?
ANS: Refused to answer
What does “400%–The Cost of Productivity Losses to Employers Associated with Chronic Disease” mean in English? Are you saying that if no employees had chronic disease everyone would be four times as productive, meaning waiters could serve four times as many tables, doctors could see four times as many patients, pilots could fly planes four times faster, etc.?
ANS: Refused to answer
How are Denver Children’s Hospital’s wellness program participants “230% less likely to utilize the extended illness benefit” than non-participants, given that it is not possible for anyone to be 230% less likely to do anything than anyone else?
ANS: Refused to answer
Should you remove the “3.27-to-1 ROI” claim from your website now that the author of the article containing that claim has walked it back three times while the nonprofit RAND Corporation has also dismissed it and no one has ever replicated it, and the average data is from 2004?
ANS: Refused to answer
Postscript: Any apologies, explanations, changes etc. added at later dates, following the initial posting
None
Keywords: US Corporate Wellness, Brad Cooper
Share this:

Milliman Magic Saves North Carolina More Medicaid Money Than Was Actually Spent
Milliman, Community Care of North Carolina
Short Summary of Intervention:
Increase payments to providers and add EMRs and add case managers in the hopes of reducing admissions and emergency room expenses
Links to and List of Materials Being Reviewed:
- Milliman Cost Savings Report
- Questioning the Widely Publicized Savings Reported for North Carolina Medicaid


Summary of key figures and outcomes:
- $177-million savings in 2007 in children’s admissions alone, increasing in the years after that
- Increase in costs of program more than offset by admissions reduction
Questions for Community Care of North Carolina:
The CCNC website says CCNC is “saving money” and yet the federal government data above notes that North Carolina Medicaid’s costs are between 24% and 40% higher than the costs in surrounding states. How is this “saving money”?
ANS: Refused to answer
North Carolina has suffered cost overruns amounting to more than a billion dollars just since CCNC became the provider for almost all non-disabled adults and children in the state. How is that track record consistent with “saving money”?
ANS: Refused to answer
Why did you hire consultants — and pay them more taxpayer money than any other consultants had ever been paid to do this work — who had never done this type of analysis before and didn’t even realize that the answers were already online?
ANS: Refused to answer
Questions for Milliman:
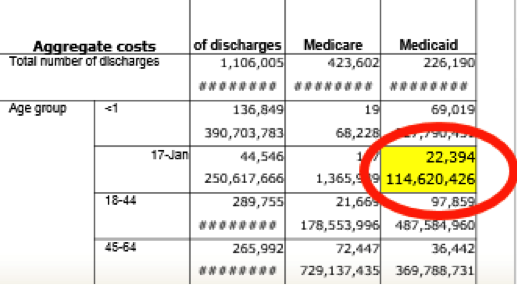
How is it possible to save at least $177,000,000/year starting in 2007 in children’s admissions when the government’s own data collected expressly for the purpose of studies like these shows you only spent $114,000,000 in 2006?
ANS: Refused to answer
Your defense has been that 2006 was not the baseline. However, the years prior to 2006 all show spending figures lower than $114,000,000. So which year was the baseline?
ANS: Refused to answer
You have also said that there is no baseline period. Can you point us to any other study in any reputable journal which did not have a baseline period?
ANS: Refused to answer
Why did you suppress all the government data above that completely contradicted your findings, or did you not know the government collected this data both on comparative per capita costs and on admissions by age group and payer?
ANS: Refused to answer
If you did not know about this online data, shouldn’t you be changing your conclusions and/or returning North Carolina taxpayers their money?
ANS: Refused to answer
If you thought this authoritative government data showing the opposite was irrelevant or wrong, could you explain why?
ANS: Refused to answer
Were you aware that Mercer’s previous study for North Carolina was also thoroughly discredited for not using that government data and thereby coming up with an impossible answer (the study has quietly been removed from the Community Care of North Carolina website as a result)?
ANS: Refused to answer
If surrounding states have similar Medicaid programs and most North Carolina children were already in CCNC, why not just take advantage of that “natural control” and compare the state as a whole to other states, especially because the federal data mentioned above had already been collected for all those states?
ANS: Refused to answer
In your Letter to the Editor following publication of the above article questioning your savings, which consisted of four questions about the savings calculation, why you didn’t answer any of the four questions the article asked?
ANS: Refused to answer
The very first page of your report says the decline in admissions more than offset the increases in other categories, thus netting out to the massive savings you calculated. Yet after it was shown that admissions did not decline at all, you said in your Letter to the Editor that the decline came from “categories other than admissions.” Which is it – admissions accounted for more than 100% of the net savings, offset by other categories, or other categories accounted for all the savings?
ANS: Refused to answer
Page 19 of your report says “other Milliman consultants may hold different views.” If members of your own organization wouldn’t agree with you, why should others agree with you when you suppressed data, contradicted yourself, and found mathematically impossible savings?
ANS: Refused to answer
Admission rates in the specific disease categories CCNC was focused on — asthma and diabetes — underperformed surrounding states. In diabetes admissions actually increased on an absolute basis. Where did the savings come from if not from the targeted conditions?
ANS: Refused to answer
Share this:

Dee Edington Drains The Life Out Of The Vitality Group’s Distortion Of His Work
The Vitality Group
Short Summary of Company:
“Vitality is an active, fully integrated wellness program designed to engage your employees on their Personal Pathway to better health. Employers can choose to introduce the Vitality experience with one of our comprehensive plans. Activate is designed to bring wellness into the workplace. Elevate includes all the components of Activate, plus additional engagement features.”
Materials Being Reviewed
The Vitality Group “wearables at work” presentation. This presentation describes the health risk reduction achievable through engaging members at workplaces by wearing activity trackers.
Summary of key figures and outcomes:

Questions for Vitality Group:
You appear to be claiming that people who are “not active” reduced their risk factors simply by being engaged, without actually doing or reporting anything. A health services researcher might say that instead of taking credit for both the 6-point decline in the study group and the 5-point decline in the de facto control group risk, in reality only the difference between the two groups (1 point) could be attributable to fitness activities. If you disagree, can you explain exactly what it is that makes people in the inactive group so successful even if they don’t do anything?
ANS:
The amount that could be attributable to fitness activities is the difference between the two groups compared. For clarification, we compared (1) individuals who were engaged in fitness activities with the Vitality program (who might also be using other program elements), with (2) those who were engaged in the Vitality program on other elements but were not recording fitness activities directly with us.
So the graphic focused only on the incremental difference between the described fitness and non-fitness cohorts. Both the fitness and non-fitness cohorts were participating in other aspects of the Vitality program to track and improve their health, but the non-fitness group did not record their fitness activities through Vitality. Individuals in the non-fitness group may also have engaged in some fitness activities but simply did not log any of these activities through the Vitality program.
Observation::
Thank you for that clarification. When I look at the “difference between the two groups compared” I am seeing a 5-point decline in the first group and a 6-point decline in the second group, netting out to 1% as an “incremental difference,” rather than the 13% and 22% declines you claim,, but perhaps readers will see it differently.
How does your claim of success adjust for dropouts, and the likelihood that dropouts would have worse performance than people who were willing to be measured twice?
ANS:
This analysis did not include an adjustment for dropouts as the intent was not to make assumptions about unknown risk factors. A more detailed investigation could include this as a refinement.
Are you familiar with the concept of the “natural flow of risk” described on this slide researched and prepared by the “father of wellness measurement,” Dee Edington?
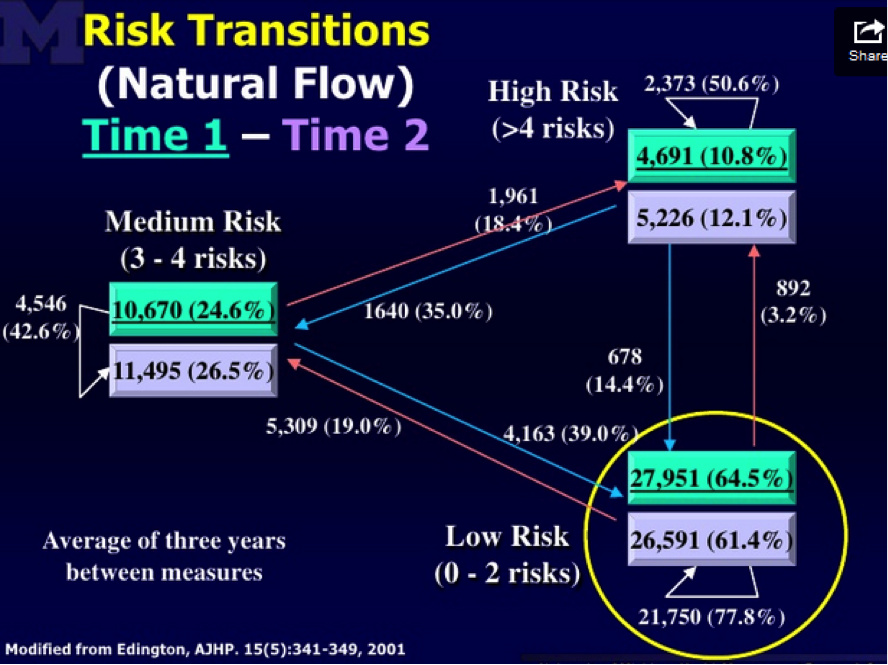
Edington’s research shows that nearly 50% of people with >4 risk factors will eventually move to a lower risk category on their own. Having been exposed to this “natural flow of risk” data, do you still believe that the non-active and active members (both groups were selected on the basis of having >4 risk factors) declined in risk due to the program, or else could some or all of the decline be due to (a) self-selection into the active group; (b) ignoring discouraged dropouts; and (c) the natural flow of risk?
Response:
Yes, we did allow for this effect by looking at the net changes in overall risk groupings by level of activity in the Vitality program. In other words, the percentages shown account for the overall flow of risk, including those who improved over the period but also those who deteriorated. The graphic focused on the proportion of high risk people in each group, but did allow for people moving into the group over the period.
Dee Edington’s work found that expected natural migration is actually a deterioration in risk groups as people naturally flow to high risk.
Often there is a tendency in wellness to compare consistent cohort risk transitions to these expected natural migration increases. Although both cohorts in the analysis saw an overall net improvement in risk groups, this comparison to natural migration was not the intent of this analysis. Instead the intent was to compare the relative changes in the two cohorts. This analysis showed that the cohort who engaged in fitness activities through Vitality had a lower proportion of high risk individuals as of their first risk measure, but had a greater net improvement in risk groups as of the last measure than those who did not engage in fitness activity through Vitality
Observation:
Hmm…well we can’t both be right. I’m looking at the exact same Dee Edington slide you are, but I am seeing the population’s risk “naturally flow” in both directions, not just “a deterioration in risk groups as people naturally flow to high risk.” Obviously the validity of the alleged declines in your cohorts is dramatically different depending on whether one uses your interpretation of Dr. Edington’s work (in which case your results are outstanding) or mine (in which case except for 1%, they are due to the natural flow downward of the highest-risk segment).
Like Alvy Singer did with Marshall McLuhan in Annie Hall, I took the liberty of asking Dee Edington himself to referee our disagreement. This is his response:
“The correct interpretation of that slide and of my work is that the natural flow of risk in a population moves in both directions, and must be understood in order to gauge impact of an intervention. It is not valid to simply start with people who were high-risk and claim credit for all risk reduction in that cohort while ignoring people who migrate in the other direction.”
Share this:

Wellnet Detects Undetected Claims Costs
Wellnet
Short Summary of Intervention:
Risk reduction program. “Our company’s focus is on exceptional execution and the manner in which health benefits are delivered and managed. Healthcare is personal and we treat it that way. Our mission to provide a level of service, collaboration and integration you will not find elsewhere in the marketplace.”
Materials Being Reviewed:

Summary of key figures and outcomes:
- 18-to-1 ROI
- $463,000 reduction ($180 per person) in medical spending, on a base of about $6 million.
- $21 million reduction in “undetected claims costs” on 55 high-risk members ($4 million) and 453 medium-risk members ($17 million).
- Medical trend reduction from 8% to 0.06%
Questions for Wellnet:
What are “undetected claims costs”? We can’t find an insurance company that has heard of them, and we can’t find any definition on Google, or even any reference to them at all, other than Wellnet’s.
ANS: Refused to answer
It’s not clear whether the 18-to-1 ROI is driven by the $180/person reduction in medical spending or the $21 million reduction in “undetected claims cost.” If the former, does that mean your wellness program only cost $10 per person?
ANS: Refused to answer
If the latter, how does the $21 million in “undetected claims costs” relate to the $6 million in detected claims costs?
ANS: Refused to answer
You list 508 medium-risk and high-risk members whose risk reduction accounted for the $21 million in “undetected claims costs.” Is it possible that many of the unmentioned 2000 employees and dependents who are low-risk might increase risk factors and therefore offset those savings, as Dee Edington’s model below would predict?
ANS: Refused to answer

By changing the axes on the graphs so that the cost bars are not drawn to scale, wouldn’t the physical difference in the height of the bars (about 50%) appear to dramatically overstate the savings (about 7.3%)? Doesn’t omitting the “$5.0” hashmark on the top graph exacerbate this effect even more?
ANS: Refused to answer
How does the 7.3% negative spending trend on the lower graph tie to the 0.06% positive spending trend claimed in the first section?
ANS: Refused to answer
On just the 55 high-risk members alone, you are saving $73,000 apiece, about 4 hospitalizations each. Can you share how this might be possible to do, through your wellness tools?
ANS: Refused to answer
Share this:

Wellsteps ROI Calculator Doesn’t Calculate ROI…and That’s the Good News
Wellsteps
Short Summary of Intervention:
“At Wellsteps, we’ve created a series of research-based ROI calculators to help you estimate the effect of well-designed wellness programs on health care costs, absenteeism, and presenteeism. Each of the three ROI calculators will examine a different employee expense and will help you determine whether investing in wellness strategies makes sense for your company. A well-designed wellness program is one that changes the health behaviors of employees, spouses, and dependents, and lowers health risks, reduces chronic disease, and helps worksites create a culture of health. The design of the WellSteps turnkey wellness solution was based partly on this body of evidence.”
Materials Being Reviewed:
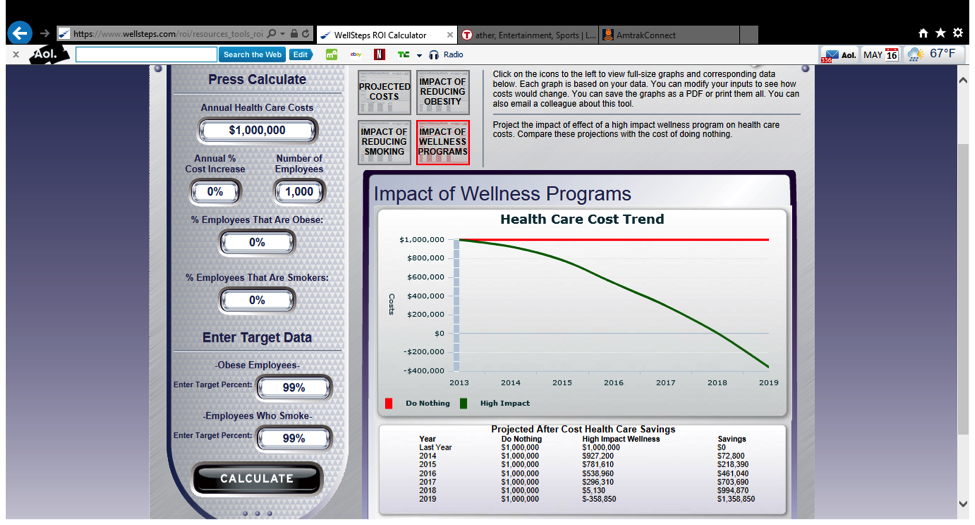
Wellsteps ROI Calculator . You input your number of employees, health spending, and goals for obesity and smoking cessation. The calculator will tell you how much money you can save through the Wellsteps program.
Summary of key figures and outcomes:


Questions for Wellsteps:
In the first example above, your model calculated massive savings even with no change in obesity and smoking. In the second example, your model calculated the same massive savings even with a huge increase in obesity and smoking. It seems that no matter what smoking and obesity data we enter once we factor out inflation itself, your ROI calculator reduces healthcare costs to a level below zero by 2019. How is this possible?
ANS: Refused to answer
Shouldn’t a spike in smoking and obesity rates from 0% to 99% increase healthcare spending rather than reduce it?
ANS: Refused to answer
Your May 2014 email blast, sent out a few days after The Health Care Blog exposed your ROI model as being invalid, says your model is supported by “every wellness ROI study ever published” (a step up from being “research-based” on a “body of evidence” as your website says). We recognize that asking you to list “every wellness ROI study ever published” would be burdensome, but could you direct us to just one study that says increasing smoking and obesity can improve workforce health and/or reduce healthcare costs to below zero?
ANS: Refused to answer
Does “every wellness ROI study ever published” include the RAND studies in Health Affairs that have found negative ROIs?
ANS: Refused to answer
How are you able to “guarantee” this ROI, since it is impossible to reduce spending to a negative number?
ANS: Refused to answer
Since you’ve known that the Wellsteps ROI Calculator is invalid since this fact was pointed out to you in October 2013 and you have updated your model twice since then, how come you have elected to continue to overstate savings by a mathematically impossible figure?
ANS: Refused to answer
You lead your marketing blast by saying that “11,000 brokers and consultants” have used this ROI model? Are we the first of those 11,000 people to observe negative savings?
ANS: Refused to answer
Do you see any irony in publicly accusing one of the principals of this website, Al Lewis, of acting like a “tobacco executive lying to Congress” when even tobacco executives wouldn’t claim that smoking reduces healthcare costs like your model says it does?
ANS: Refused to answer
Where in your “ROI Calculator” can I find the ROI?
ANS: Their ROI Calculator doesn’t calculate an ROI so there was no point in even asking them to answer this question. The good news about Wellsteps is that NASA employees don’t have to worry about job security because these people are not rocket scientists.
Update: July 16, 2014
Addendum: Wellsteps accusation that I “entered false data” into the ROI calculator was posted on the “Wellness Is a Business Strategy” Linkedin Group
“It has come to our attention that an outspoken critic has entered false data into these calculators in order to make a point. We certainly support free speech; however, we wonder how valid the point can be when it is based on false data?”
“Use valid estimates for the percent of the current obese and smokers in an employee population. We provide the estimated default numbers based on national data of 33% and 20% respectively in all three calculators. In our combined 50 years of academic and consulting work, we cannot think of one employer with a 0% obesity AND 0% smoking rate. Again, valid estimates work best.”
Actually, we ran every combination of data from a reduction of 99% in smoking and obesity rates to an increase of 99% in smoking and obesity rates. Some of that data might have been “false” (whatever that means), but the result was always the same: $1358.85 in savings/employee by 2019. Here are two more examples, this time using the default numbers they recommended. The first is @$5000/employee in annual costs, with no change in smoking or obesity. The second is @50,000/employee. The answer is still the same.


How come, regardless of what assumptions get entered (and we have now entered many vastly different combinations of cost and success), the answer is always that by 2019, you save $1,358.85 per employee once you zero out inflation?
ANS: Refused to answer
Would you now admit that entering $5000/employee in spending and 33% obesity and 20% smoking (the national averages) constitute, in your words, “valid estimates that work best” ?
ANS: Refused to answer
Following my exposé, your model no longer allows a user to enter increases in smoking and obesity. Is this to prevent users from figuring out that even if the rates of smoking and obesity increase, the math underlying your model based on “every ROI study ever published” will still show a reduction of $1,358.85/employee in 2019?
ANS: Refused to answer
How come the model shows that very same $1358.85 (now finally “rounded” to $1359) potential savings from reducing obesity and smoking even if I start out with no smokers or obese employees?

Update–May 1, 2015: Wellsteps Doubles Down on Dishonesty
Two people forwarded us this, a sequel to their email that their ROI model is “based on every ROI study ever published”:

Update–September 10, 2015: Wellsteps Triples Down on Dishonesty
Somehow they reported costs going up and down at the same time. Even wellness industry math doesn’t allow that.
Share this:

Propeller Health’s Success Claims Just Don’t Fly
Propeller Health
Short Summary of Intervention:
“The Leading Mobile Platform for Respiratory Health Management,” according to the company website, Propeller Health helps patients manage their asthma by using an electronic sensor to help patients record their inhaler use and track their medications.
Links to Materials Being Reviewed
This abstract of these interim findings for a study financed by the California Healthcare Foundation, which is also an investor in Propeller Health, also links to others.
Other treatments include Forbes’ David Shaywitz Two Examples Highlight Challenges of Demonstrating the Benefit of Digital Health Technology/ and The Health Care Blog’s Meet Propeller Health, Digital Health’s Poster Child for Invalid Savings Reporting (Al Lewis and Vik Khanna)
Summary of key figures and outcomes:
- 40 people studied for four months
- No change in Asthma Control Test Scores
- 25% less rescue drug use
- 62% reduction in inpatient utilization
- $688/asthmatic in savings from reduced ER and Inpatient usage (vs. $282 “improvement” for control group), before the costs of the equipment is added back in
- 67% of asthmatics presenting in ER admitted to the hospital (vs. 20% for country as a whole)
Questions for Propeller Health:
Why shouldn’t a disinterested observer question the linkage between California Healthcare Foundation financing the study and also investing in your company?
ANS: Refused to answer
Doesn’t the large treatment effect violate Dr. John Ioannidis’ conclusion that large treatment effects are usually wrong, especially because both groups received the same treatment?
ANS: Refused to answer
Wouldn’t one expect that such large improvements in avoided hospitalizations be caused by equally large improvements in the official Asthma Control Test Scores, instead of no improvement in those test scores?
ANS: Refused to answer
Should the Asthma Control Test Score algorithm be revisited due to its failure to predict this massive improvement?
ANS: Refused to answer
In disease management, typically a reduction in inpatient utilization is achieved by an improvement in adherence generating more drug use. How were you able to achieve the opposite?
ANS: Refused to answer
Why did you write “Patients on Propeller save more than $600/year” on your website when the net reduction in spending (vs. the control group) was only $406?

ANS: Refused to answer
How do you reconcile your claim of $688 in savings per asthmatic in ER and inpatient utilization with the fact that commercial health plans only spend about $400 per asthmatic on asthma-coded ER and inpatient utilization?
ANS: Refused to answer
Your principal investor calls the $206 reduction in costs for the control group an “improvement” in costs. How could it be called an improvement when there was no intervention in the control group and therefore any change is due to regression to the mean and the Hawthorne effect? Wouldn’t it be more ethical to acknowledge that?
ANS: Refused to answer
Why did you decide to overlook the 67% inpatient admission rate of patients who present at the ER, and why is it several times the expected rate of 20% or less?
ANS: Refused to answer
Your own principal investigator, Rajan K. Merchant, is on record as saying that this data shouldn’t have been released by “Proppeller” because the study isn’t complete yet. “Anything prior is pure speculation,” he observed. How do you respond to your principal investigator’s opinion that you should not have released this data?
ANS: Refused to answer
Responses, addenda, apologies, retractions, changes etc.
Addendum: Email exchange
Email from Propeller:
The trial [is] still underway and we look forward to the principal investigators submitting the findings for peer review later this year.
Our Response:
Thank you. So then another question is: why did you release this information now if indeed the trial is still underway and the principal investigator says the information shouldn’t have been released? (Note: It is OK to apologize if it was a mistake. There is a spot on the website where we will note apologies.)
ANS: Refused to answer or apologize
Share this:

ShapeUp Falls Down Trying To Do Math For Highmark
ShapeUp
“By uniting people based on common health interests and goals, and empowering them to spread the word by inviting their colleagues to join, the program created thousands of connections and enabled Highmark to build a grassroots communication strategy that reached the company’s entire employee population. This strategy, combined with the organic spread of peer-to-peer motivation, support and accountability, helps launch and sustain successful company-wide wellness challenges year after year.”
Materials Being Reviewed
ShapeUp’s Case Study of Highmark employees’ weight-loss program. Highmark is a 19,600-employee Blue Cross health plan headquartered in Pittsburgh, PA.
Summary of key figures and outcomes:


Questions for ShapeUp:
Out of Highmark’s 19,600 employees, are we right in calculating that only 163 (0.8% of the total, or 1.3% of participants) improved their BMI status?
ANS: Refused to answer
If about 9000 people (46% of 19,600) lost an average of 5.6 pounds, how come only 163 shifted to a lower weight category? Statistically speaking, shouldn’t roughly 1800 people have crossed the threshold into a lower category if the average weight loss was 5.6 pounds?
ANS: Refused to answer
Do you have a sense of how many people, on average, would improve their BMI status over this same (undisclosed) period absent a formal workplace wellness program, through initiatives undertaken on their own?
ANS: Refused to answer
How come you didn’t reveal the number of employees whose BMI status deteriorated over that period?
ANS: Refused to answer
How many people dropped out of the program, due to disappointing results or other factors?
ANS: Refused to answer
The program was quite brief, and it’s generally accepted that short-term weight loss rarely translates into long-term weight maintenance. Were participants able to keep the weight off after the program ended, or was this largely short-term weight loss?
ANS: Refused to answer
If indeed you were to add back in non-participants, dropouts, people whose BMIs went up, and people who were unable to keep the weight off after the program ended, it is possible that the 0.8% success rate would actually be lower?
ANS: Refused to answer
You equate “improved health” with reduced weight and propose “losing 10 pounds in 8 weeks,” but couldn’t reduced weight in a short period be due to crash-dieting, which would not be healthy?
ANS: Refused to answer
Why would a program as “motivating” (using your own word) as ShapeUp’s need to be accompanied by Highmark’s $4200 fines for non-participation, believed to be the highest in the country?
ANS: Refused to answer
August 20–Score one for They Said What: ShapeUp has taken down its boast about this 0.8% short-term improvement in weight classifications. We hope that this is a step in the right direction and that they will seek validation from a legitimate validation source going forward. We doubt it but look forward to being proven wrong.
March 8–Pittsburgh Post-Gazette lets Highmark pile on, explaining why they fired ShapeUp.
Share this:

Is Mercer Cooking Staywell’s Books At British Petroleum?
Staywell, Mercer
Short Summary of Intervention:
Comprehensive wellness program offered to all American employees of British Petroleum. Staywell was the vendor. Mercer was hired by British Petroleum to validate the savings claimed by Staywell.
Materials Being Reviewed
- Staywell and Mercer Analysis of British Petroleum Program
- The Health Care Blog Review of British Petroleum Wellness Program
Summary of key figures and outcomes:
No visuals were provided. A review of the articles is recommended.
Questions for Staywell and Mercer
You claimed that spending would have increased by 10.5% instead of 7% across the entire company, absent the wellness program. Since only 1139 people reduced their risk factors (not including non-participants and dropouts whose risk factors might have increased), are you saying that by reducing a risk factor, those 1139 people were responsible for the entire difference in trend for the 62,000 employees and dependents versus the original trend you projected?
ANS: Refused to answer
The savings you are claiming works out to about $17,000 for each person whose risk factors declined, almost the equivalent of avoiding one heart attack for each person who reduced a risk factor. Are you suggesting that most of those 1139 would have had heart attacks otherwise, even though fewer than 200 American BP employees had a heart attack the previous year?
Note to Staywell’s and Mercer’s actuaries: if costs decline $17,000 every time someone reduces a risk factor and your spending is about a third of that level, you can wipe out your healthcare bill by getting a third of your employees to reduce a risk factor.
ANS: Refused to answer
How does $17,000 in savings for BP employee reducing a risk factor reconcile with Staywell’s own website claiming only $100 in savings for each person reducing a risk factor in a multi-employer study?
ANS: Refused to answer
How does this unprecedented savings reconcile with the PepsiCo findings, published in a leading journal (Health Affairs) by leading researchers (RAND), that concluded applying approximately the same interventions to PepsiCo’s workforce using the same consulting firm (Mercer) actually lost money?
ANS: Refused to answer
Did Mercer notice the discrepancy between Staywell’s alleged results and PepsiCo’s (and also Staywell’s own website) and inform British Petroleum of it, since Mercer’s job was to validate this program on behalf of British Petroleum and ensure that the savings were accurate?
ANS: Refused to answer
Since a wellness program can only reduce wellness-sensitive medical events, how come you elected not to disclose the rate of wellness-sensitive medical events across the entire population before and after the program?
ANS: Refused to answer
Did you inform British Petroleum that there was an article on The Health Care Blog about their program that reached the opposite conclusion you reached?
ANS: Refused to answer
Staywell employees Jessica Grossmeier (who authored the journal article) and Paul Terry (Chief Science Officer) were asked privately and by many of the people who posted comments to rebut The Health Care Blog and declined. Wouldn’t it have been a useful discussion to explain to readers how British Petroleum could have saved more than 100 times what you yourself said was possible?
ANS: Refused to answer
Share this:

Pharos Innovations Produces Wellness Savings On Day One
Pharos Innovations
Short Summary of Intervention as described by company:
“Today, Health Systems, Physician Groups and Accountable Care Organizations are utilizing Pharos programs to:
- Reduce health care costs and increase care quality
- Increase care coordinator case loads and population penetration
- Increase care plan and treatment compliance and improve clinical outcomes
- Drive reduced readmissions and increased gain share bonus participation”
Materials Being Reviewed
Evaluation of Tel-Assurance Heart Failure Module
Summary of key figures and outcomes:

79% reduction in admissions, and an 85% reduction in total costs ($4458 per patient per month falling almost immediately to $652).
Questions for Pharos Innovations:
Your savings happened immediately after the program began. No other disease management program claims that its savings are immediate and yet many programs have interventions similar to yours. What did you do differently to make you so successful?
ANS: Refused to answer
You write that to be included in the analysis during this 18-month study period, a member need only have participated for 15 days. How were you able to achieve such dramatic results over such a long period with only 15 days’ required participation?
ANS: Refused to answer
The most dramatic decline in admissions – about 90% — happened the first month (February) of the program. Are you saying that you were able to find all these members’ contact information, schedule the phone calls to the members and their caregivers to convince them to join the program, schedule initial followup calls to start trying to manage the members, make the scheduled phone calls, collect the information, get members to visit their doctors, and adjust lifestyles and medications — all by February 1 for a program starting January 1?
ANS: Refused to answer
Your “unchanged” matched cohort seems to have declined by 25% over the course of your intervention. How are you defining “unchanged”?
ANS: Refused to answer
Why did Wellpoint ask you to take their name off this study?
ANS: Refused to answer
Can you get someone at Wellpoint to endorse this program in the space below?
ANS: No one from Wellness endorsed the program in this space
If admissions declined 79% but total costs declined 85%, wouldn’t the use of physicians, labs, drugs, home care and all other services have to decline by much more than 85% in order to have the average decline in costs be 85%? Very conservatively assuming that admissions account for only half of all costs for CHF patients, wouldn’t all other costs need to decline to about $200/month, which is much lower than a typical commercially insured person spends and far lower than a Medicare member spends?
ANS: Refused to answer
Wouldn’t such a low non-admissions spending figure mean that most patients would no longer be taking most meds or insulin, seeing doctors regularly, getting tested, participating in therapy, etc.?
ANS: Refused to answer
What did the New England Journal of Medicine get wrong when they tested your intervention and found no impact at all, which is much different from an 85% cost savings?
ANS: Refused to answer
Pharos isn’t just validated, but rather it is claimed to be strongly validated. Can you distinguish being “strongly validated” from garden-variety validation?
ANS: Refused to answer
Who did that “strong validation” and can they explain their rationale below?
ANS: Refused to answer
Why, if you can’t answer these questions that have been asked for several years now and Wellpoint has withdrawn its name, is this study still on your website?
ANS: Refused to answer
Share this:

More Milliman Magic From North Carolina
Milliman, Community Care of North Carolina
Short Summary of Intervention:
Increase payments to providers and add EMRs and add case managers in the hopes of reducing admissions and emergency room expenses
Links to and List of Materials Being Reviewed
- Milliman Cost Savings Report
- Questioning the Widely Publicized Savings Reported for North Carolina Medicaid


Summary of key figures and outcomes:
$177-million savings in 2007 in children’s admissions alone, increasing in the years after that
Increase in costs of program more than offset by admissions reduction
Questions for Community Care of North Carolina:
The CCNC website says CCNC is “saving money” and yet the federal government data above notes that North Carolina Medicaid’s costs are between 24% and 40% higher than the costs in surrounding states. How is this “saving money”?
North Carolina has suffered cost overruns amounting to more than a billion dollars just since CCNC became the provider for almost all non-disabled adults and children in the state. How is that track record consistent with “saving money”?
Why did you hire consultants — and pay them more taxpayer money than any other consultants had ever been paid to do this work — who had never done this type of analysis before and didn’t even realize that the answers were already online?
Questions for Milliman
How is it possible to save at least $177,000,000/year starting in 2007 in children’s admissions when the government’s own data collected expressly for the purpose of studies like these shows you only spent $114,000,000 in 2006?
Your defense has been that 2006 was not the baseline. However, the years prior to 2006 all show spending figures lower than $114,000,000. So which year was the baseline?
You have also said that there is no baseline period. This strikes us as curious but we could be wrong: Can you point us to any other study in any reputable journal which did not have a baseline period?
Why did you suppress all the government data above that completely contradicted your findings, or did you not know the government collected this data both on comparative per capita costs and on admissions by age group and payer?
If you did not know about this online data, shouldn’t you be changing your conclusions and/or returning North Carolina taxpayers their money?
If you suppressed the data because you thought it was irrelevant, wouldn’t it have been more ethical to acknowledge the existence of the authoritative government data, but then describe why the federal government data didn’t apply and let the reader decide whether it was relevant?
Given that Mercer’s previous study for North Carolina was thoroughly discredited for not using that government data and thereby coming up with an impossible answer (the study has quietly been removed from the Community Care of North Carolina website as a result), wouldn’t it have been wise not to make that same mistake again?
If surrounding states have similar Medicaid programs and most North Carolina children were already in CCNC, why not just take advantage of that “natural control” and compare the state as a whole to other states, especially because the federal data mentioned above had already been collected for all those states?
In your Letter to the Editor following publication of the above article questioning your savings, which consisted of four questions about the savings calculation, why you didn’t answer any of the four questions the article asked?
The very first page of your report says the decline in admissions more than offset the increases in other categories, thus netting out to the massive savings you calculated. Yet after it was shown that admissions did not decline at all, you said in your Letter to the Editor that the decline came from “categories other than admissions.” Which is it – admissions accounted for more than 100% of the net savings, offset by other categories, or other categories accounted for all the savings?
Page 19 of your report says “other Milliman consultants may hold different views.” If members of your own organization wouldn’t agree with you, why should others agree with you when you suppressed data, contradicted yourself, and found mathematically impossible savings?
Admission rates in the specific disease categories CCNC was focused on — asthma and diabetes — underperformed surrounding states. In diabetes admissions actually increasing on an absolute basis. Didn’t you feel this might be a red flag to suggest that the huge savings your model was showing you might not be valid?

